Original Scientific Paper, Volume 23, Number 2, Year 2025, No 1271, pp 269-279
Received: Nov 05, 2024 Accepted: Apr 14, 2025 Published: Jun 16, 2025
DOI: 10.5937/jaes0-54570
AN EXPERIMENTAL STUDY FOR DAMAGE CHARACTERIZATION OF POLYURETHANE STEEL SANDWICH PLATE UNDER MODE-I LOADING
Abstract
An experimental study is presented to characterize the face or core debonding on sandwich plate specimens under mode-I loading. The experiment was conducted with the specimens of an asymmetrical double cantilever beam (ADCB). Several specimens with different core thicknesses were analysed to estimate the strain energy release rate (SERR). The SERR of mode-I (GI) calculation uses two data reduction methods namely the Modified Beam Theory (MBT) and Compliance Calibration (CC) methods. The GI depicted on the R-Curve expresses the damage behaviour of the sandwich plates. The critical energy release rate (GIC) resulted of the MBT data reduction method produces a higher value than CC method, due to the differing assumptions between the two methods. The GIC value also correlates directly with the peak load value. The difference in sandwich plate thickness, particularly the core material thickness, does not significantly affect the damage behavior regarding the sandwich material's GIC value.
Highlights
- Characterized face/core debonding in sandwich plates under mode-I loading using ADCB specimens of varying core thicknesses.
- Mode-I GI evaluated from R-curve using image-based crack tracking and two data reduction methods: MBT and CC.
- GIC remained largely unaffected by variations in core thickness, indicating stable damage behavior across sandwich configurations.
- MBT yielded consistently higher GIC values than CC, attributed to differing mechanical assumptions in the data reduction approaches.
Keywords
Content
1 Introduction
The polyurethane steel sandwich plate consists of two layers of steel faceplates bonded by a polyurethane elastomer matrix core. Thin faceplates separated by thick core material increase the cross-section moment of inertia, thereby increasing the plate's bending stiffness and flexural strength significantly without increasing the structure's weight [1]. In marine applications, polyurethane steel sandwich plates were developed for ship materials because they are claimed to reduce construction weight by 4-9% [2, 3, 4]. A low-density core material causes the sandwich plate’s transverse shear stiffness to be lower than homogeneous materials [5, 6]. This combination produces an optimum strength-to-weight ratio; however, sensitivity to damage will increase [7, 8].
Optimizing the sandwich structure design requires a deeper comprehension of the material's behaviours. Researchers have been investigating the properties of sandwich materials for several years. Recently, there has been increased focus on assessing damage behaviour through the principles of fracture mechanics. Typically, material damage is evaluated using criteria such as maximum load capacity, fracture mechanics, and other failure standards. Characterizing sandwich plate damage behaviour is part of the damage tolerance analysis process to prevent fatalities. [9]. Research on damage behaviour generally carried out locally at the specimen level because analysis at large and complex is very complicated and expensive. The damage propagation analysis conducted experimentally and numerically with mode-I, mode-II loading, or mix-mode [10, 11, 12]. This method's fracture characterization has also been applied to composite sandwich materials made of carbon and glass epoxy with a honeycomb core, providing valuable insights for analysing damage in sandwich materials [13, 14].
In recent decades, researchers have dedicated considerable efforts to developing testing methods aimed at evaluating the damage behavior of composite sandwich materials. Prominently, the single cantilever beam (SCB) and double cantilever beam (DCB) tests have been recognized as international standards for assessing mode I interlaminar fracture toughness. [15, 16, 17]. The SCB test method is utilized to investigate the impact of various factors - such as core thickness, core density, temperature, and geometry—on the material's fracture toughness. [18, 19]. Both experimental and numerical methods, particularly finite element analysis, are commonly employed to study damage behaviour [20, 21]. Several international standardization institutions, such as ASTM and JIS, made this test procedure an international standard for testing interlaminar fracture toughness. The researchers widely use this test method, primarily to analyze composite sandwich materials.
However, fracture properties associated with the face/core debonding of steel polyurethane sandwich plates have not been well characterized compared to the damage behaviour of composite sandwich material. Very limited research has focused on the damage characterization of steel sandwich systems with polyurethane cores. This presents a critical gap in literature. This gap highlights the need for further investigation into such configurations, particularly under mode-I loading conditions. To address this, the present study offers an original experimental investigation focused on characterizing face/core debonding in steel-polyurethane sandwich plates under mode-I loading. By focusing on steel-polyurethane sandwich configuration this research addresses a significant knowledge gap and provides new insights into interfacial fracture mechanisms that are critical for improving structural performance and reliability in practical applications
In this study, the face/core debonding toughness represented by strain energy release rate (SERR) and depicted on R-Curve, is used to reflect the damage behaviour. To examine the influence of core thickness on the strain energy release rate (SERR), several specimens with varying core thicknesses were evaluated. The SERR was calculated using two methods: Modified Beam Theory (MBT) and Compliance Calibration (CC). This study aims to provide essential data for the analysis of more complex sandwich structure components.
2 Meterials and methods
2.1 Sandwich beam specimens for mode-i loading test
The sandwich material analysed is a steel polyurethane sandwich with steel faceplates and a polyurethane elastomer core. The characteristics of sandwich materials are shown in Table 1.
Table 1. Sandwich material properties [3]
|
No |
Part |
Material |
Density (Kg/m3) |
Young’s Modulus (MPa) |
Poisson’s Ratio |
|
1 |
Faceplates |
Steel AH 36 |
7850 |
206.103 |
0,3 |
|
2 |
Core |
Polyurethane Elastomer |
1098 |
901,95 |
0,36 |
The calculation of sandwich plate thickness is based on the strength index (R), which must be less than 1 (R ≤ 1) [22]. The sandwich plate thickness resulting from this calculation is the faceplate thickness (t1& t2) and the core material thickness (tc). Four core thickness variations were used for analysis, as shown in Table 2.
Table 2. Specimens for Mode-I loading test
|
No |
Specimen |
Pre-Crack length (mm) |
Faceplate thickness (mm) |
Core thickness (mm) |
Sandwich plate thickness (mm) |
|
1 |
OB-C1 |
5 |
6 |
15 |
27 |
|
2 |
OB-C2 |
5 |
6 |
18 |
30 |
|
3 |
OB-C3 |
5 |
6 |
21 |
33 |
|
4 |
OB-C4 |
5 |
6 |
24 |
36 |
The focus of damage tolerance analysis in sandwich plates is on understanding and identifying crack growth within the material. This phenomenon can be assessed through three modes: mode-I loading (opening), mode-II loading (shearing), and mode-III loading (tearing), with mode-I being the most investigated. The mechanical testing involved sandwich plate specimens, which were produced using the heat-cured casting method. These specimens dimension measured length (L) at 300 mm and width (B) at 40 mm, with the thickness composed of an upper faceplate thickness (t1), core thickness (tc), and bottom faceplate thickness (t2), as illustrated in Figure 1. To replicate mode-I (opening) crack deformation as shown in Figure 2, the mechanical testing was conducted under mode-I loading to induce face/core debonding.
|
Fig. 1. Sandwich plate specimen |
Fig. 2. Mode-I crack (opening) [23] |
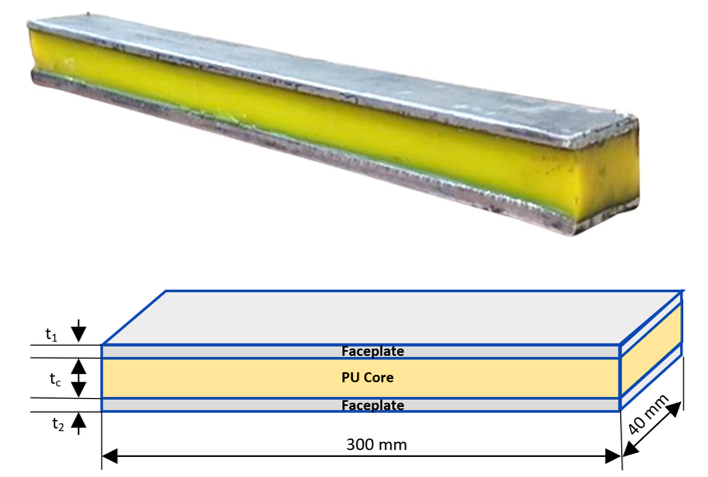

The specimen for this test is an asymmetrical double cantilever beam (ADCB), which was modified to suit the sandwich plate configuration. Artificial damage was introduced to the core at the tip of the specimen. The length of this initial damage, referred to as the pre-crack (a0), which is the distance from point of loading (P) and crack tip. A pre-crack was created using a band saw on the polyurethane core layer, extending from one end of the specimen to a point 30 mm from the loading point, located 2 mm from the top faceplate (t1). Prior to testing, the mode-I crack extension test was performed to ensure a sharp crack tip, facilitating crack propagation along the pre-crack. An eye plate was installed 50 mm from the end of the specimen (x) to direct the loading grip hinge, as illustrated in Figure 3.
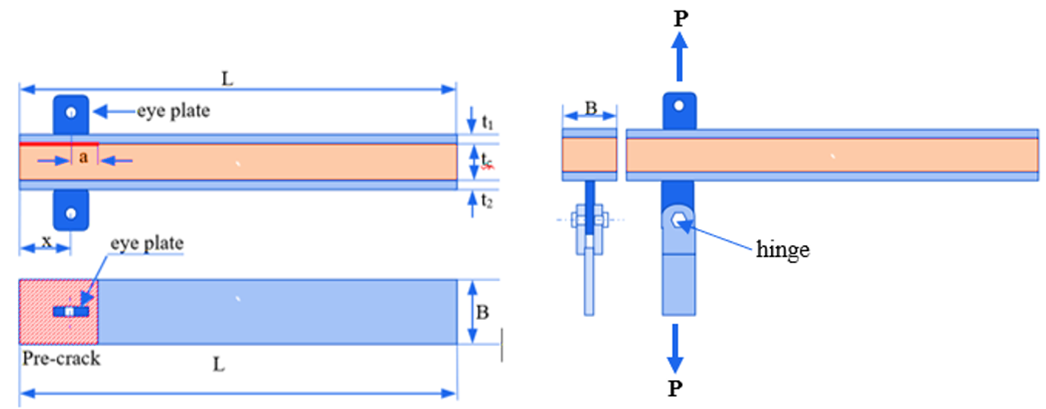
Fig. 3. Specimen with the hinge
2.2 Experimental procedure
The mechanical testing for mode-I crack propagation adhered to the procedure outlined in ASTM D 5528. This procedure is adopted because there is no test procedure for face/core debonding testing on steel sandwich materials. The tensile load was applied continuously at a 20 mm/minute speed. Thirty frames/second video capture documenting the side of the specimen with dots during the test. The image analysis method detects an increase in the specimen's crack length at each specific time interval. This simple method was chosen because of the limitations of the sensor or strain gauge installed on the test specimen. The mechanical test equipment is an Electrohydraulic Servo Universal Testing Machine (HT-9501). The configuration and setup of the testing machine are presented in figure 4.

Fig. 4. Experimental setup for mode-I loading test: 1) testing machine; 2) power pack; 3) PC/computer; 4) clamp; 5) sandwich beam specimen; 6) upper hinge; 7) lower hinge
2.3 Fracture toughness assessment
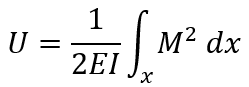
Fracture toughness assesses the material system's ability to resist crack propagation and is typically quantified using either the strain energy release rate (SERR) or the stress intensity factor (K). In this study, the fracture toughness was estimated using the SERR, as it aligns best with the specimen and test configuration employed. The experimental results are represented by the load-displacement curve, which illustrates the relationship between the crosshead displacement and the applied load throughout the test. This curve is utilized to calculate the SERR value, serving as an indicator of damage to the polyurethane cores under mode-I loading conditions (GI) [24]. In this study, the data reduction method for calculating the strain energy release rate is based on beam theory. The derivation process begins with its simplest form.
 |
(1) |
Since the strain energy which is defined as the volume integral:
|
|
(2) |
Consider these relationships and assume stiffness and cross-sectional area remain constant:
|
|
(3) |
|
|
(4) |
|
|
(5) |
|
|
(6) |
|
(7) |
|
 |
(8) |

Consider only the beam from the crack tip to the end load, and the following relationship:
|
|
(9) |
|
(10) |
The strain energy:
|
|
(11) |
Normalize by the crack front width:
|
|
(12) |
Strain energy release rate:
|
|
(13) |

Consider crack opening displacement, derived from Euler Bernoulli Beam theory:
|
|
(14) |
Substituting we obtain strain energy release rate’s final from
|
|
(15) |
This beam theory has the assumption that the specimen assumes as built-in/clamped, which mean no rotation or displacement, and the crack front is oriented perfectly perpendicular to the loading direction. However, the specimen does not have perfect build-in so to the GIC calculation using this method will be overestimated. To remedy this issue, the Eq. 16 needs to be used to correct the GI determination [24].
|
|
(16) |

Fig. 5 Curve to determine |∆| on the MBT method [24]
The value|∆| is obtained from the curve shown in Figure 5. Determining |∆| in equation 16 requires a compliance or flexibility value, which is the inverse of stiffness. Compliance is obtained by dividing displacement by load, as in equation 17.
|
|
(17) |
The second data reduction method is the Compliance Calibration (CC) method. In the CC method, the GI value is determined using Equation 18.
|
|
(18) |

Where P is (load) in Newtons, δ is displacement (mm), b is the width of the specimen (mm), a is the length of the delamination crack (mm), and n is the slope of the compliance calibration curve line. This n value is obtained by measuring the slope of the curve shown in Figure 6.
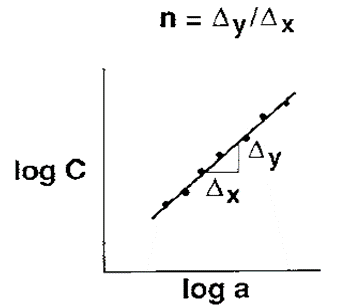
Fig. 6. Compliance calibration curve [24]
3 Results and discussion
3.1 Experiment results
The test outcome of each specimen is shown as load-displacement curve [24]. Figure 7 shows the curve obtained from the experiment. This curve depicts the crack mouth opening displacement (CMOD) in correlation with the tensile load applied to the specimen, with four different core thicknesses. The horizontal axis represents displacement in millimetres (mm), while the vertical axis indicates the load value in Newtons (N).
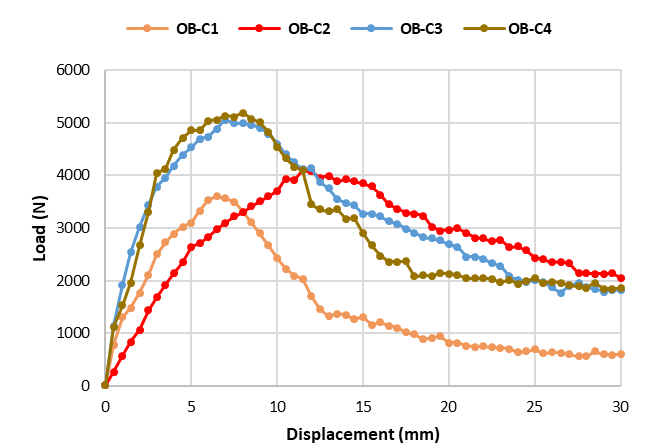
Fig. 7 Load-displacement curve
Data on load and displacement were recorded by the load cell of the universal testing machine used in the experiments. As illustrated in Figure 7, all specimens exhibited a similar trend in their curves. The load increased linearly until reaching the peak, after which it gradually decreased. Subsequently, the load remained constant despite an increase in crosshead opening displacement, extending to a certain length. The OB-C3 and OB-C4 specimens demonstrated nearly identical curve shapes. However, these four test specimens displayed variations in peak load values, with thicker specimens achieving higher peak loads. This observation suggests that the thickness of the specimen significantly influences the material's peak load capacity, indicating that thicker specimens possess a greater ability to bear loads.
In this experiment, the specimen was given an artificial pre-crack in the core adjacent to the upper faceplate, ±1-2 mm from the upper faceplate. This artificial pre-crack produces the crack propagation phenomena. The initial crack propagation occurs along the pre-crack and then crosses to the interface of faceplate and core, as in Figure 8. While the crack extension is still occurring along the core, the load continues to increase until it reaches the peak load, and after the crack extension crosses towards the interface, the load gradually decreases and reaches the plateau region. This condition shows that opening displacement and crack extension formation at the interface require a smaller load than in the core, which means the interface is weaker than the core. The crack propagation will always lead to the weakest part.

Fig. 8 Crack growth phenomenon of the specimen
In this study, a continuous tensile load was applied at a rate of 20 mm per minute until maximum displacement was achieved. The propagation of the debonding crack was monitored using an image analysis technique. The specimen was initially painted white and marked with black dots to facilitate analysis, with a green screen set up in the background. A video was recorded at a rate of thirty frames per second, capturing the side of the specimen with the white dots during the testing process.
To enhance the clarity of crack propagation changes, image pre-processing was performed to alter the background to black using online software, creating a stark contrast with the specimen. The unloaded specimen was assigned coordinates, and the pre-crack length was measured as the initial position. Subsequent images were captured at 0.25-second intervals to assess crack length. Assuming the crack plane is horizontal, the change in crack length between time intervals reflects crack propagation during each interval. This data was then correlated with load-time and load-displacement measurements, which are outputs of the testing process. The relationship between crack length, load, and displacement is illustrated in Figure 9.
|
(a) |
(b) |
|
(c) |
(d) |
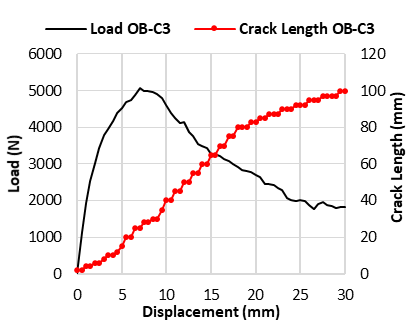
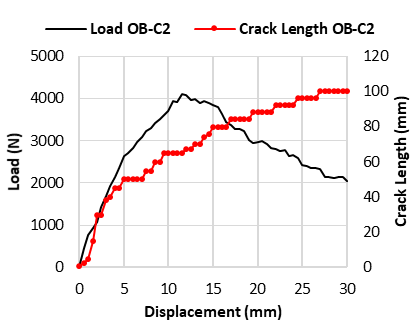

Fig. 9 Change of the load and crack length as the displacement increases of specimen (a) OB-C1; (b) OB-C2; (c) OB-C3; (d) OB-C4
Figure 9 demonstrates that crack propagation within the specimen is characterized by instability. Initially, the crack length gradually increases as the load intensifies. However, following the peak load, the growth of the crack length becomes irregular, indicating that this increase is not linear in relation to displacement. When the load reaches its stable point in the plateau region, crack propagation continues to occur intermittently.
3.2 Discussion
According to the linear elastic fracture mechanics (LEFM), the potential energy is converted into energy for the new crack formation or the existing one extension. The SERR is quantified mathematically as energy per unit area specifically referred to as GI for mode-I loading. To calculate the SERR, several methods can be used. This study employed two data reduction techniques: Modified Beam Theory (MBT) and Compliance Calibration (CC). The critical SERR value (GIC) derived from beam theory is provided in Equation 15, while the Compliance Calibration method (CC) is determined by Equation 18. In the CC approach, the slope of the compliance calibration curve (n) is obtained from the data shown in Figure 6.
The correlation between GI and crack length is illustrated by the Resistance Curve (R-Curve), which shows the connection between a crack's resistance and its propagation. Figure 10 compares the R-curves derived from the two data reduction methods (MBT and CC) for all specimens. The R-curve represents the total energy required for the cracked plane as well as the one needed to generate a plastic zone near the crack tip. Additionally, it indicates the material's resistance to progressive crack growth. The starting point of the curve, at coordinates (0,0), corresponds to the initial condition before crack propagation, reflecting the pre-crack length (a0).
In theory, brittle material will generate flat curve, suggesting that its resistance to crack propagation remains unchanged throughout the process. This behavior is attributed to the absence of a plastic zone at the crack tip. Consequently, the surface energy is a constant characteristic of the material, with its value equal to the critical energy release rate (GC) [25, 26]. Conversely, materials undergoing ductile fracture typically display an increasing R-curve, a phenomenon caused by the development of a plastic zone at the crack tip. As the crack propagates, the size of this plastic zone expands, necessitating more energy for continued crack growth. This relationship is reflected in the upward trend of the R-curve. Figure 10 presents the R-curves derived from the experimental results for the sandwich beam specimens analyzed in this study, with all specimens demonstrating a rising curve shape, although after reaching the peak GI value, the curve shape shows a different trendline.
|
(a) Specimen OB-C1 |
(b) Specimen OB-C2 |
|
(c) Specimen OB-C3 |
(d) Specimen OB-C4 |


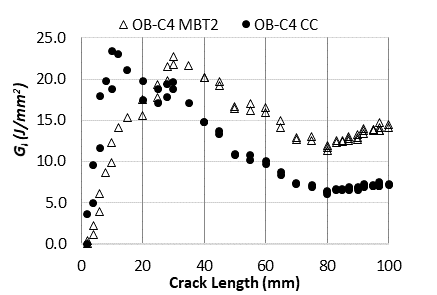
Fig. 10. Resistance curve (R-curve) of the specimens
Damage characteristics of material with a rising R-curve can be identified by strain energy release rate at the start of the crack propagation, but precisely observing the crack initiation is challenging [23]. In this study, the observation utilizes image capture from the testing process with image-based analysis. This digital image analysis measures a crack extension at each time interval and then connects to the GI value to produce a curve, as shown in Figure 10. Since most of the crack extension occurs at the interface between the polyurethane core and the steel faceplate, which has different properties, the fracture characterization becomes complicated.
The R-curve starts with increasing GI until reaches the peak value. In this zone, the applied load is transformed into energy to propagate the crack accordingly. At the initial rise the applied load transforms into stress concentration, building a plastic zone at the crack tip rather than propagating the crack. Since the crack propagation occurs at the polyurethane core, the high GI shows that this core requires more energy to crack. After the peak value, the curve tends to soften, where the GI decrease gradually. The decrease of GI occurs when crack propagation leads to the interface between faceplate and core. After the crack reaches the interface and propagate along the interface the curve enters the constant GI. In this plateau zone, the critical energy release rate (GIC) for the interfacial debonding phenomena determined by averaging the GI. Table 3 shows the average GIC of all specimens, determined based on the two data reduction methods, MBT and CC.
Table 3. The critical energy release rate (GIC)
|
No |
Specimen |
Peak Load (N) |
MBT |
CC |
||
|
GIc |
DEV |
GIc |
DEV |
|||
|
(J/mm2) |
± |
(J/mm2) |
± |
|||
|
1 |
OB-C1 |
3604.655 |
6.089 |
0.836 |
3.893 |
0.600 |
|
2 |
OB-C2 |
4371.318 |
13.375 |
0.397 |
6.773 |
0.440 |
|
3 |
OB-C3 |
5165.746 |
14.368 |
1.150 |
7.598 |
0.880 |
|
4 |
OB-C4 |
5329.079 |
13.143 |
0.852 |
6.907 |
0.329 |
The GIC determined using the data reduction method based on Modified Beam Theory (MBT) shows a higher value than the GIC determined using the Compliance Calibration (CC) method. This phenomenon is due to the differing assumptions between the two methods. The MBT method adjusts the crack length by a value of |∆| to accommodate rotational movement possibilities when applying a mode-I load. This method incorporates the foundation effect by increasing the original crack length by |∆|. Meanwhile, the GIC determination using the CC data reduction method uses the actual crack length measures from the specimen. It does not accommodate the foundation effect, resulting in a lower GIC.
The GIC value also correlates directly with the peak load value, where the OB-C1 specimen, which has a much lower peak load than the other three specimens, shows a significantly lower GIC value than the other specimens. Meanwhile, the OB-C2, OB-C3, and OB-C4 specimens, which have relatively close peak load values each other, result in similarly close GIC values. This phenomenon indicates that the difference in sandwich plate thickness, particularly the core material thickness, does not significantly affect the damaged behavior regarding the sandwich material's GIC value. The significant difference in the OB-C1 specimen is more influenced by the load-displacement value, which is significantly lower than the other three specimens. This difference may be due to imperfections in the specimen resulting from the manufacturing process, causing its strength to be inconsistent with the other specimens. In future studies, it may be essential to analyze specimens with varying faceplate thicknesses to comprehensively examine the impact of sandwich plate thickness on damage behavior under mode-I loading conditions.
4 Conclusions
This experimental study focuses on characterizing face/core debonding in sandwich plate specimens subjected to mode-I loading. The specimens, designed as asymmetrical double cantilever beams (ADCB) with varying core thicknesses, were subjected to continuous mode-I loading to induce face/core debonding. The propagation of the debonding crack was monitored using an image analysis technique. Damage characteristics were expressed through the strain energy release rate (SERR) as a function of crack length (a), illustrated in the Resistance Curve (R-curve). The calculation of mode-I SERR (GI) utilized two data reduction methods: Modified Beam Theory (MBT) and Compliance Calibration (CC), resulting in a rising R-curve. After reaching the peak value, the curve tends to soften before stabilizing at a relatively constant GI value. The critical strain energy release rate (GIC) determined by the MBT method was found to be higher than that obtained using the CC method, due to the differing assumptions underlying the two approaches. Additionally, the GIC value demonstrated a direct correlation with the peak load value. However, variations in the thickness of the sandwich plates, particularly in core material thickness, did not significantly impact the damage behavior in terms of the GIC value.
Acknowledgements
The research leading to these results has received financial support from the “BPI-Beasiswa Penyelesaian Studi S3” of the Ministry of Education and Culture of The Republic of Indonesia.
References
- SANDCORe, (2013). Best Practice Guide for Sandwich Structures in Marine Applications. University of Newcastle upon Tyne, New Castle.
- Ismail, A., Zubaydi, A., Piscesa, B and Panangian, E. (2021) A comparative study of conventional and sandwich plate side-shell using finite element method, IOP Conference Series: Materials Science ans Engineering, 2nd International Conference on Mechanical Engineering Research and Application (iCOMERA 2020), DOI: 10.1088/1757-899X/1034/1/012027
- Ismail, A., Zubaydi, A., Piscesa, B. and Tuswan (2021). Study of Sandwich Panel Application on Side Hull Of Crude Oil Tanker, Journal of Applied Engineering Science, 19(4), 1090-1098, DOI:10.5937/ jaes0-30373.
- Sujiatanti, S.H., Zubaydi, A., Budipriyanto, A. (2018). Finite Element Analysis of Ship Deck Sandwich Panel. Applied Mechanics and Materials, vol. 874, 134- 139, DOI: 10.4028/www.scientific.net/AMM.874.134
- Folie, G. M. (1971). The Behaviour and Analysis of Orthotropic Sandwich Plates, Building Science, vol. 6, pp. 57-67, DOI: 10.1016/0007-3628(71)90004-1
- Nordstrand, T., Carlsson, L. A. and Allen, H. G. (1994). Transverse shear stiffness of structural core sandwich. Composite Structures, vol. 27, pp. 317-329, DOI: 10.1016/0263-8223(94)90091-4
- Palomba, G., Epasto, G and Crupi, V. (2021). Lightweight sandwich structures for marine applications: a review. Mechanics of Advanced Materials and Structures, vol 29(26), pp.4839-4864, DOI:10.1080/15376494.2021.1941448
- Ariesta, R.C., Zubaydi, A., Ismail, A., Tuswan, T.. (20210 Damage evaluation of sandwich material on side plate hull using experimental modal analysis, Materials Today: Proceedings 47, pp. 2310-2314. DOI: 10.1016/j.matpr.2021.04.293.
- Zenkert, D. (2009). Damage Tolerance of Naval Sandwich Panels. Daniel, I. M.; Gdoutos, E. E.; Rajapakse, Y. D. S. (Eds), Major Accomplishments in Composite Materials and Sandwich Structures. Springer Dordrecht, pp 279–303.
- Rarani, M. H., Shokrieh, M. M. and Camanho, P. P. (2013). Finite element modelling of mode I delamination growth in laminated DCB specimens with R-curve effects. Composites Part B: Engineering, vol. 45 (1), pp. 897-903. DOI: 10.1016/j.compositesb.2012.09.051
- Ramji, A., Xu, Y., Yasaee, M. and Grasso, M. (2020) Delamination migration in CFRP laminates under mode I loading. Composites Science and Technology, vol. 190, DOI: 10.1016/j.compscitech.2020.108067
- Chen, C. D. and Lai, W. L. (2020). The analysis of mode II strain energy release rate in a cracked sandwich beam based on the refined zigzag theory. Theoretical and Applied Fracture Mechanics, vol. 107, DOI: 10.1016/j.tafmec.2020.102504
- Moreira, R. D. F., de Moura, M. S. F. S., Rocha, R. J. B., and Oliveira, C. F. M. (2022). Mode II fracture caracterisation of a honeycomb/carbon-epoxy sandwich panel using the assymmetric end-notched flexure test. Journal of sandwich Structures & Materials, vol 24(7), DOI: 10.1177/10996362221118031
- Shokrieh, M. M., Zeinedini, A., and Ghoreishi, S. M. (2017). On the mixed mode I/II delamination R-curve of E-glass/epoxy laminated composites. Composites Structures, vol. 171, pp. 19-31. DOI: 10.1016/j.compstruct.2017.03.017
- Whitney, J. M., Browning, C. E., and Hoogsteden, W. (1982). A double cantilever beam test for characterizing mode I delamination of composite material. Journal Reinforced Plastics and Composites, vol. 1(4), pp. 297-313, DOI: 10.1177/073168448200100
- Aviles, F., and Carlsson, L. A. (2008). Analysis of the sandwich DCB specimen for debond characterization, Engineering Fracture Mechanics , vol. 75 (2), pp. 153-168, DOI: 10.1016/j.engfracmech.2007.03.045
- Ramantani, D. A., de Moura, M. F. S. F., Campilho, R. D. S. G., and Marques, A. T. (2010). Fracture characterization of sandwich structures interfaces under mode I loading. Composites Science and Technology, vo. 10(9), p. 1386–1394, DOI: 10.1016/j.compscitech.2010.04.018
- Maleki, F. K., and Toygar, M. E. (2019). The fracture behavior of sandwich composites with different core densities and thickness subjected to mode I loading at different temperatures. Materials Research Express, vol. 6, no. 4, DOI: 10.1088/2053-1591/aafc02
- Irven, G., Whitehouse, A., Carolan, D., Fergusson, A., and Dear, J. P. (2023). Toughening of face-sheet core bonds in sandwich structures. Engineering Fracture Mechanics, vol. 290, DOI: 10.1016/j.engfracmech.2023.109498
- de Moura, M. S. F. F., Moreira, R. D. F., Rocha, R. J. B., and Oliveira, C. F. M. (2022). Determination of the fracture energy under mode I loading of a honeycomb/carbon-epoxy sandwich panel using the asymmetric double cantilever beam test. Journal of Sandwich Structures & Materials, vol. 24, no. 6 , pp. 1977–1992, DOI: 10.1177/10996362221114906
- Lee, S. and Ji, W. (2022). Measurement of pure mode I fracture toughness at a sandwich interface and parametrization of the R-curve for a cohesive element. Composite Structures, vol. 291, DOI: 10.1016/j.compstruct.2022.115599
- Lloyd’s-Register. (2021) Rules for the Application of Sandwich Panel Construction to Ship Structure., Lloyd’s Register
- Anderson, T. L. (2005). Fracture Mechanics Fundamentals and Applications, 3rd ed., Taylor & Francis
- ASTM. (2013). ASTM D5528-13 Standard Test Method for Mode I Interlaminar Fracture Toughness of Unidirectional Fiber-Reinforced Polymer Matrix Composites, vol. 13
- Irwin, G. R. (1970). Fracture strength of relatively brittle structures and materials. Journal of the Franklin Institute, vol. 290, no. 6, pp. 513-521, DOI: 10.1016/0016-0032(70)90234-6
- Siswanti, H., Zubaydi, A., Piscesa, B., Syahab, H., Ariesta, R.C. (2025). Study of polyurethane elastomer cores interfacial fracture resistance of the sandwich materials for ship structures. IOP Conf. Series: Earth and Environmental Science. 1461. pp.1-10. doi:10.1088/1755-1315/1461/1/012005.
Conflict of Interest Statement
The authors declare that no conflict of interest exists that could have influenced the results presented in this manuscript
Author Contributions
Data Availability Statement
There is no dataset associated with the study or data is not shared.
Supplementary Materials
There are no supplementary materials to include.