Volume 23 number 3 article 1292 pages 547-557
Received: Apr 03, 2025 Accepted: Jun 24, 2025 Available Online: Jul 28, 2025 Published: Sep 15, 2025
DOI: 10.5937/jaes0-57980
APPROACH FOR IDENTIFYING UNSAFE ROAD SECTIONS IN THE REPUBLIC OF NORTH MACEDONIA
Abstract
The influence of road and environmental characteristics on traffic safety is a key aspect of the analysis of traffic accidents. To gain a more detailed understanding of this relationship, this study analyzes the factors that contribute the most to their frequency and severity, with an emphasis on their identification, quantitative assessment, and potential mitigation. The research focuses on the analysis of 161 sections of the main road network in the Republic of North Macedonia, with a total length of approximately 1300 km, using data related to road geometric characteristics, pavement conditions, vertical and horizontal signage, climatic influences, and traffic intensity. To assess their impact on the weighted accident index (Wi), multiple statistical and machine learning methods are applied, including correlation analysis and algorithms such as AdaBoost, Random Forest, Bagging Regressor, and Gradient Boosting, along with validation techniques. Thorough data processing and analysis enable the detection of critical factors with the greatest impact on safety, leading to the development of a methodological approach for predicting hazardous segments of the road network. The obtained results and the developed model can serve as effective tools for enhancing existing strategies for road safety assessment, allowing timely planning of interventions and reducing the risk of traffic accidents. This research represents a step towards the systematic identification of factors contributing to traffic accidents and provides a scientifically grounded approach to improving road safety measures.
Highlights
- Model developed for predicting accident-prone road sections using 23 infrastructural, traffic, and climate parameters.
- Four machine learning methods (AdaBoost, Random Forest, Bagging, Gradient Boosting) applied for feature impact assessment.
- Pavement condition, longitudinal slope, and curvature identified as most influential safety risk factors.
- Weighted accident index (Wi) formula proposed for proactive detection and ranking of unsafe road segments.
Keywords
Content
1 Introduction
Traffic accidents represent one of the most serious global public safety concerns, particularly among the younger population. According to the World Health Organization (WHO), road traffic crashes are the leading cause of death for individuals aged 5 to 29, with more than 1.19 million fatalities recorded each year [1]. Although significant progress has been made in developed countries—thanks to systemic measures and improved infrastructure—the average fatality rate in the European Union still stands at 45.5 deaths per million inhabitants [2].
In Macedonia, the situation is even more alarming, with 69.5 traffic-related deaths per million people [3], placing the country well above the European average. These figures highlight the urgent need for a new approach to road safety—one that goes beyond reliance on historical accident data and focuses on identifying and predicting hazardous road segments in order to enable timely interventions.
Modern analytical tools such as machine learning and geospatial analysis make it possible to detect high-risk segments even before accidents occur. This proactive approach significantly enhances the ability to plan targeted safety measures and manage road risk more effectively.
The goal of this research is to develop a methodological approach for predicting high-risk road sections by analyzing key influencing factors such as road geometry, pavement condition, vertical and horizontal signage, climatic conditions, and traffic intensity. The study is based on the analysis of 161 sections of the main road network in Macedonia, covering a total length of approximately 1300 kilometers. The results, obtained using statistical methods and machine learning algorithms, serve as a basis for calculating a weighted accident index (Wi) and for creating a predictive model aimed at identifying unsafe segments. The expected outcome is a contribution toward improving current road safety assessment methodologies and enabling more efficient planning of interventions to reduce accident risk.
1.1 Related work and scientific contribution
Previous studies on the identification of hazardous road segments have primarily relied on statistical evaluations or basic scoring methods. Gonzalez-Hernandez et al. [4] proposed an embedded safety evaluation framework for rural roads, integrating infrastructure data at the network scale. Paliotto et al. [5] conducted a systematic review and comparison of different approaches, highlighting the strengths and weaknesses of traditional methods versus advanced analytics. Similarly, Zhang et al. [6] emphasized the importance of data-driven strategies and machine learning in blackspot identification. Furthermore, the latest EU guidelines on road infrastructure safety [7] promote proactive assessment techniques beyond reactive accident history analysis.
This study builds upon these efforts by developing a predictive model using 23 road, traffic, and environmental parameters. Unlike earlier approaches, it applies and compares four machine learning techniques—AdaBoost, Random Forest, Bagging, and Gradient Boosting—to quantify each parameter’s influence on a reference safety measure known as the weighted accident index (Wi). This approach enables a more informed classification of risk-prone segments and supports strategic road safety interventions.
The scientific contribution of this study lies in its integration of a wide parameter set across a comprehensive national road dataset (161 sections, 1300 km), the introduction of the weighted accident index (Wi) as a reference metric, and the validation of results through multiple predictive models. The methodology enhances the objectivity of risk identification and offers scalable potential for broader network-level safety planning.
2 Materials and methods
2.1 General information about the road network
The road network in Macedonia spans a total of 14,475 km and is classified into motorways, regional, and local roads [8]. The motorway (main road) network, with a length of 897 km, forms a vital part of the national and trans-European transport infrastructure [9]. It includes highways, expressways, and two-lane roads that provide the main traffic connections throughout the country and with neighboring states.
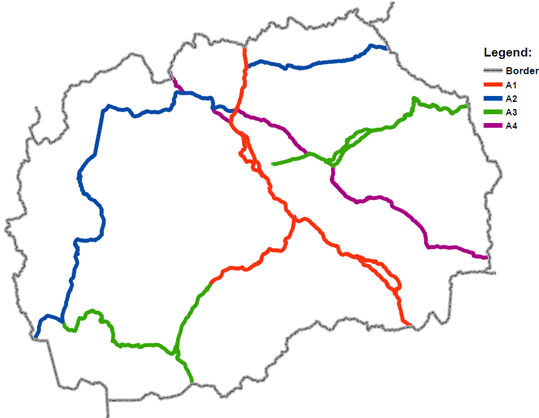
Fig. 1.Overview map of the state road network
This study focuses on the main roads A1, A2, A3, and A4, which belong to different infrastructural categories and exhibit diverse geometric characteristics. Although the official length of the main road network is 897 km, the analysis covers approximately 1300 km due to the separate treatment of both directions on multilane highways. This approach enables a more detailed and objective evaluation of the impact of various factors on road safety.
2.2 Description and processing of the data
The combination of the two categorization approaches enables a comprehensive and systematic method for data processing. Temporal categorization highlights change over time, while classification by characteristics provides a clear view of the role and impact of each factor. The data were processed using GIS tools, statistical techniques, and machine learning methods, allowing the analysis to identify both spatial and temporal patterns.
- Road Characteristics.This category includes various geometric and functional parameters, such as average speed limits, road curvature, curve radii, longitudinal slopes, and elevation. Additional variables include lateral forces in curves, stopping sight distance, pavement smoothness, rutting, surface friction, and general pavement condition. The analysis also incorporates data on the density of interchanges, bridges, and viaducts, as well as the condition of vertical and horizontal road markings [10][11].
- Traffic Characteristics. Traffic volume is expressed through the Annual Average Daily Traffic (AADT), based on continuous automatic measurements and manual samples for vehicle classification. This parameter provides insight into traffic intensity and its influence on risk levels [12].
- Environmental Characteristics. Climatic factors are represented through average and extreme annual values for precipitation and temperature, collected over a ten-year period from meteorological stations. The data were processed using geospatial methods to ensure high resolution at the level of individual road sections [13].
- Traffic Accident Data. The frequency and spatial distribution of traffic accidents were analyzed using a weighted accident index (Wi), which accounts not only for the number of crashes but also for their severity. The index is calculated by assigning predefined weights based on injury severity – a weight of 85 is assigned for each fatal crash, 10 for crashes with serious injuries, and 1 for those with minor injuries. The total weighted value for each section is then divided by its length, resulting in an average risk per kilometer. The weighting values are aligned with previous research and professional practice, where the severity of accidents reflects their societal impact and the urgency for intervention. This index serves as a core indicator for evaluating and ranking the safety performance of each individual road section. [14].
2.3 Methodology for assessing the influence of parameters on the weighted accident index (Wi)
To gain a deeper understanding of the factors that influence the severity and frequency of traffic accidents, this chapter presents a systematic analysis of various parameters related to road geometry, traffic conditions, and environmental influences. A range of statistical and machine learning methods have been applied to determine the degree and direction of impact that each parameter has on the Weighted Accident Index (Wi).
The analysis involves several steps – starting with an initial statistical assessment of linear relationships, followed by the application of machine learning algorithms that enable a more in-depth and non-linear evaluation. The different methods are used in a complementary manner, aiming to provide a balanced and realistic insight into the importance of each individual factor.
For this purpose, several methods were sequentially applied, all aimed at quantitatively estimating the percentage influence of each individual parameter on the Weighted Accident Index (Wi). First, Pearson correlation analysis was conducted to assess the linear dependence between the selected input variables and Wi. Subsequently, the Adaptive Boosting (AdaBoost) method was applied to improve prediction accuracy by combining multiple weak learners. The Random Forest method was used to evaluate the relative importance of each factor through an ensemble of decision trees. In parallel, the Bagging Regressor was implemented to reduce variance and enhance model stability via bootstrap aggregation. Finally, the Gradient Boosting method enabled iterative refinement of the predictions by minimizing weighted errors, thus allowing for a detailed ranking of the influence of each parameter. Each of these approaches contributes to the overall assessment by providing a multi-layered understanding of the factors that most significantly determine the safety risk across road sections.
3 Results and discussion
3.1 Pearson correlation: Linear assessment of the relationship between parameters and Wi
Pearson correlation is a fundamental statistical method used to determine the linear relationship between two variables. In this study, it is applied as an initial assessment to examine the connection between each individual parameter and the Weighted Accident Index (Wi), aiming to identify factors that may influence road safety. The correlation coefficient (r) ranges from -1 to +1, where values close to +1 indicate a strong positive correlation, values near -1 suggest a strong negative correlation, and values around 0 indicate no significant linear relationship [15][16]. Formally, r is calculated using the following formula:
| \[r=\frac{\sum\left(X_i-X\right)\left(Y_i-Y\right)}{\sqrt{\sum\left(X_i-X\right)^2}\cdot\sqrt{\sum\left(Y_i-Y\right)^2}}\] | (1) |
Where Xi and Yi represent the values of the parameter and the weighted accident index (Wi), and X and Y are their respective mean values. For easier interpretation, correlation values are classified as weak (0.1–0.3), moderate (0.3–0.5), and strong (>0.5), while p-values are also observed to determine statistical significance.
Figure 2 shows the Pearson correlation matrix for all parameters, where warm tones indicate positive correlation with Wi, cool tones represent negative correlation, and neutral colors show weak or no relationship.
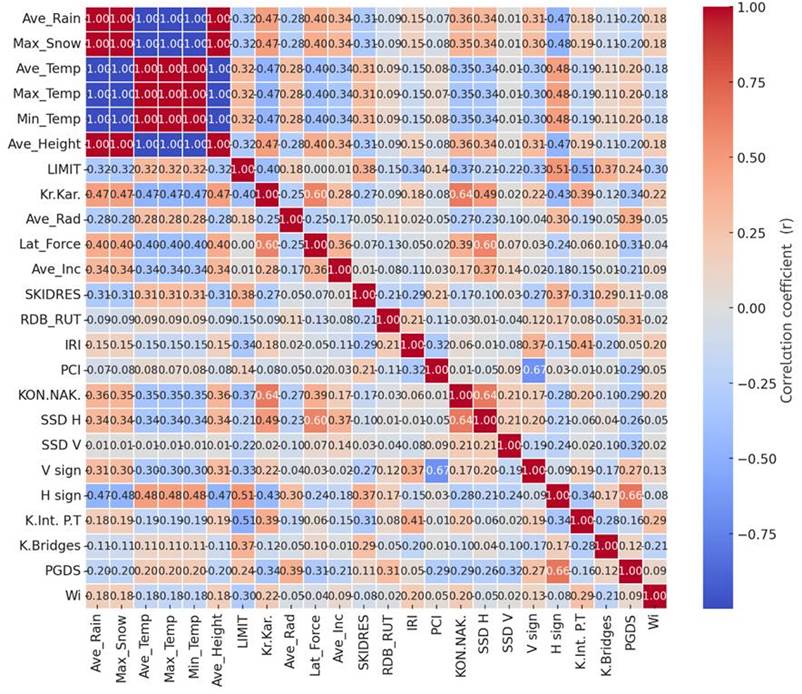
Fig. 2. Pearson correlation matrix for the analyzed parameters
It is important to note that this method serves only an indicative purpose and does not establish causal relationships. Therefore, the results obtained through Pearson correlation are used solely for the selection of parameters that will undergo further analysis using machine learning algorithms.
3.2 Adaptive boosting method (AdaBoost)
Adaptive Boosting (AdaBoost) is a machine learning technique that combines a series of simple models to produce a more accurate and robust prediction. Instead of using a single complex model, AdaBoost builds multiple weak learners (typically shallow decision trees), where each subsequent model is trained based on the errors made by the previous ones. This iterative improvement allows for gradual reduction of prediction error and better overall performance [17].
The final model is represented by the following equation:
| \[F\left(x\right)=\sum_{t=1}^{T}{\alpha_th_t\left(x\right)}\] | (2) |
where:
- ht(x) is the t-th base model,
- αt is its weight based on prediction accuracy,
- T is the total number of iterations (models).
In this study, 100 base models with shallow depth were used, and all input data were standardized to ensure equal contribution of each parameter. The method was applied to evaluate the impact of road infrastructure, traffic, and environmental parameters on the Weighted Accident Index (Wi). As shown in Figure 3, the average longitudinal slope and pavement condition (PCI) exhibit the most significant influence on the Weighted Accident Index (Wi), emphasizing their importance in the identification of hazardous road segments.
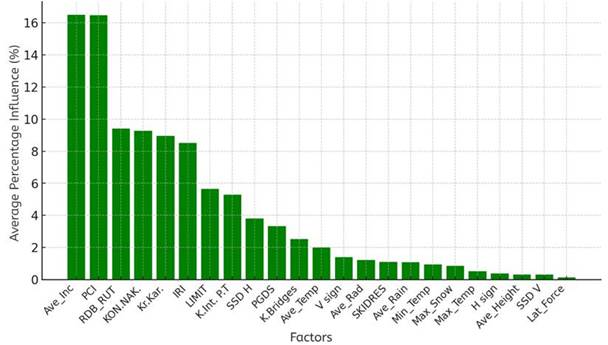
Fig. 3. Road parameter influence on the Weighted Accident Index (AdaBoost Regressor)
The performance of the AdaBoost model was evaluated using standard indicators. The coefficient of determination (R²) was 0.851, indicating that the model explains 85.1% of the variation in the weighted accident index (Wi), which reflects a solid level of predictive strength. The mean absolute error (MAE) was 3.447, and the root mean square error (RMSE) reached 4.242, pointing to a moderate average deviation and acceptable sensitivity to larger prediction errors. These results suggest that the AdaBoost method effectively captures the relationship between the input parameters and accident severity. Its ability to gradually improve prediction accuracy through iterative learning makes it a valuable tool in identifying key risk factors, particularly when dealing with structured datasets.
3.3 Random forest method
The Random Forest method is a machine learning technique that builds multiple decision trees and combines their outputs to produce more stable and accurate predictions. Each tree is trained on a different subset of the data, and the final output is obtained by averaging the predictions from all individual trees. This approach is particularly useful for analyzing complex datasets and identifying the influence of multiple factors [18][19].
In this study, the method is applied to analyze 23 parameters related to traffic volume, road geometry, pavement condition, and environmental characteristics. The model structure is defined by the following equation:
| \[Y=\frac{1}{N}\sum_{i=1}^{N}{T_i\left(X\right)}\] | (3) |
where:
- Y is the predicted value,
- N is the number of trees in the model,
- Tᵢ(X) is the prediction of the i-th tree for input X.
This technique reduces the impact of anomalies and provides a more balanced assessment of factor importance.
After training the model, the percentage influence of each parameter on the Weighted Accident Index (Wi) was calculated.
As shown in Figure 4, the model identifies the pavement condition (PCI) and average longitudinal slope as the most influential factors, followed by road curvature and superelevation.
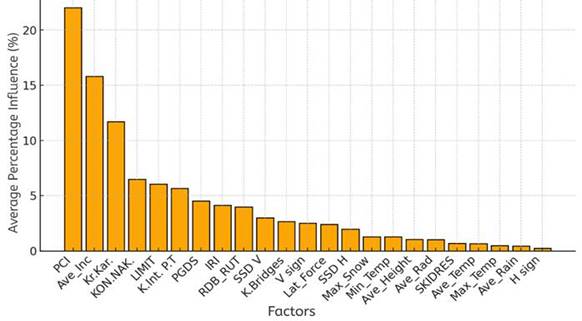
Fig. 4. Percentage influence of parameters according to the Random Forest method
The Random Forest model demonstrated reliable predictive performance, as reflected in the evaluation results. The coefficient of determination (R²) reached 0.866, indicating that 86.6% of the variation in the weighted accident index (Wi) is explained by the model. The mean absolute error (MAE) was 1.93, showing a low average deviation between predicted and actual values, while the root mean square error (RMSE) was 4.02, capturing the influence of larger discrepancies. These values confirm that the model produces stable and accurate predictions and is effective in recognizing the most influential factors associated with accident occurrence.
3.4 Bagging regressor method
The Bagging Regressor method is an ensemble learning technique designed to improve the stability and accuracy of predictions by averaging the results of multiple independent models. Rather than relying on a single model, Bagging generates various subsets from the original dataset, each used to train a separate model—typically decision trees. By combining their predictions, the method produces more balanced and robust estimates, especially when dealing with variable or complex data [20].
In this study, the method is applied to predict the weighted accident index (Wi), analyzing 23 parameters related to road geometry, traffic volume, and climatic conditions. The model includes 100 decision trees, each trained on a different bootstrap sample of the data.
The general prediction formula can be expressed as follows:
| \[Y=\left(1/T\right)\sum{\left(t=1\right)^TY_t}\] | (4) |
where:
- Y is the final predicted value,
- Yₜ is the prediction from each individual model,
- T is the total number of models.
Figure 5 illustrates the percentage influence of each parameter on the accident index based on the Bagging Regressor method.
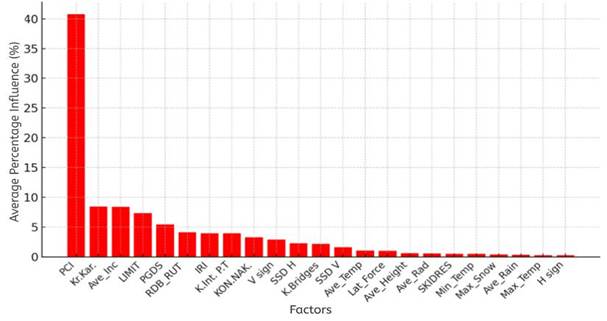
Fig. 5. Percentage influence of parameters according to the Bagging Regressor method
With an R² value of 0.871, the Bagging Regressor model showed a notably high alignment between predicted and actual values of the weighted accident index (Wi). The mean absolute error was 1.949, and the RMSE was slightly under 4, at 3.946—both indicating a low level of prediction error throughout the dataset. What stands out is the model’s ability to preserve accuracy even when facing input data with internal variability. This stability suggests that the method is not only precise but also dependable when used across different conditions, making it a solid choice for identifying which parameters exert the greatest influence on accident severity.
3.5 Gradient boosting
Gradient Boosting is one of the most effective machine learning approaches for modeling complex relationships between multiple input parameters and a dependent variable. This method is based on building a series of weak models (typically decision trees), where each subsequent model is trained based on the errors of the previous one. This iterative approach allows for a gradual improvement in prediction accuracy, resulting in a stable and powerful predictive model [21].
The fundamental equation that describes this process is:
| \[F_m\left(x\right)=F_{m-1}\left(x\right)+\gamma\cdot h_m\left(x\right)\] | (5) |
where:
- Fₘ(x) is the new predictive model after the m-th iteration,
- Fₘ₋₁(x) is the previous model,
- hₘ(x) is the weak model correcting previous errors,
- γ is the learning rate controlling the influence of the new model.
The residuals are calculated as the difference between the actual values yᵢ and the previously predicted values Fₘ₋₁(xᵢ), i.e.:
| \[e_i=y_i-F_{m-1}\left(x_i\right)\] | (6) |
Gradient Boosting was applied to evaluate the influence of parameters describing road infrastructure, traffic conditions, and environmental factors on the Weighted Accident Index (Wi). This method enables the detection of complex interactions and highlights the most influential factors.
In the output diagram presented in Figure 6, the percentage contribution of each parameter to the accident index is illustrated according to the Gradient Boosting method.
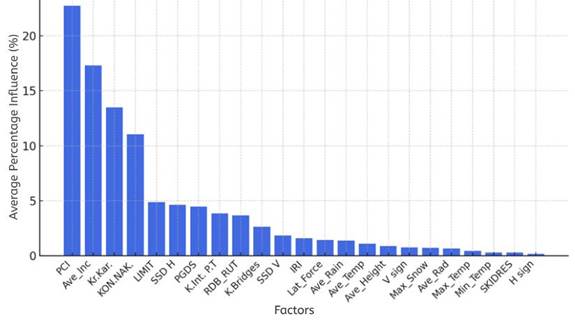
Fig. 6. Percentage influence of the parameters on the accident index according to the Gradient Boosting method
As seen in the diagram, pavement condition (PCI), average longitudinal slope (Ave_Inc), and curvature characteristics stand out as the parameters with the highest influence. Conversely, parameters such as horizontal signage, maximum temperature, and elevation show minimal contribution to the model.
Gradient Boosting achieved the highest predictive accuracy among all tested models. The coefficient of determination (R²) was 0.987, indicating that the model explains 98.7% of the variation in the weighted accident index (Wi)—a near-complete capture of the underlying patterns. The mean absolute error (MAE) was 1.03, while the root mean square error (RMSE) was 1.23, both of which are notably low and point to exceptional precision. In addition, the distribution of residuals showed no signs of systematic error, with small and evenly spread differences between predicted and actual values. This level of performance confirms that the model generalizes well and is not overfitted. Its iterative approach, which focuses on correcting residuals at each step, allows for nuanced detection of complex relationships between parameters. These results position Gradient Boosting as the most effective method in this analysis, offering both accuracy and deep insight into the factors that most strongly influence accident severity.
3.6 Averaging and normalization of results from the four methods
This section presents the combined results from the four applied machine learning models used to evaluate the influence of various factors on the weighted accident index (Wi).
Pearson correlation, although valuable for detecting linear relationships between variables, was excluded from this aggregation step because it does not provide predictive insight. It captures only linear dependence and does not account for the true importance of parameters in complex models. In contrast, the four predictive models utilize multiple trees or ensemble approaches that improve the stability and precision of the results.
To ensure a balanced evaluation, the averaging of parameter importance was weighted according to the accuracy (R² score) of each model:
- Gradient Boosting (27.6%) – highest accuracy (R² = 0.987)
- Bagging Regressor (24.4%) – high stability (R² = 0.871)
- Random Forest (24.2%) – relatively high accuracy (R² = 0.866)
- AdaBoost (23.8%) – lowest accuracy among the models (R² = 0.851)
Based on these weights, the percentage influence values from all four methods were normalized so that their total adds up to 100% for each parameter. This enables a more objective and comparable assessment of factor significance.
Table 1. Percentage influence of parameters on the weighted accident index – weighted averaging
| No. | Parameter | Abbreviation | GB | BG | RF | AB | Weighted Influence |
| 1 | Pavement Condition Index | PCI | 22.75 | 40.78 | 22.02 | 16.48 | 25.48 |
| 2 | Average Longitudinal Slope | Ave_Inc | 17.29 | 8.37 | 15.81 | 16.51 | 14.57 |
| 3 | Curvature Index | Kr.Kar. | 13.50 | 8.45 | 11.69 | 8.97 | 10.75 |
| 4 | Cross Slope Coefficient | KON.NAK. | 11.03 | 3.28 | 6.46 | 9.27 | 7.61 |
| 5 | Speed Limit | LIMIT | 4.86 | 7.35 | 6.05 | 5.66 | 5.94 |
| 6 | Rutting | RDB_RUT | 3.67 | 4.12 | 4.00 | 9.40 | 5.22 |
| 7 | Interchanges and Toll Stations | K.Int. P.T | 3.86 | 3.96 | 5.66 | 5.30 | 4.66 |
| 8 | Annual Average Daily Traffic | PGDS | 4.45 | 5.43 | 4.53 | 3.34 | 4.45 |
| 9 | Longitudinal Roughness | IRI | 1.58 | 3.97 | 4.13 | 8.52 | 4.43 |
| 10 | Horizontal Visibility Coefficient | SSD H | 4.61 | 2.29 | 1.98 | 3.80 | 3.21 |
| 11 | Bridge Parameter | K.Bridges | 2.63 | 2.15 | 2.66 | 2.53 | 2.50 |
| 12 | Age of Vertical Signage | V sign | 0.74 | 2.88 | 2.50 | 1.40 | 1.84 |
| 13 | Vertical Visibility Coefficient | SSD V | 1.83 | 1.60 | 2.99 | 0.31 | 1.70 |
| 14 | Lateral Force | Lat_Force | 1.41 | 0.98 | 2.41 | 0.14 | 1.25 |
| 15 | Average Annual Temperature | Ave_Temp | 1.07 | 1.04 | 0.65 | 1.99 | 1.18 |
| 16 | Average Horizontal Radius | Ave_Rad | 0.65 | 0.53 | 1.03 | 1.20 | 0.84 |
| 17 | Average Annual Rainfall | Ave_Rain | 1.36 | 0.31 | 0.45 | 1.07 | 0.82 |
| 18 | Annual Maximum Snowfall | Max_Snow | 0.72 | 0.36 | 1.29 | 0.85 | 0.80 |
| 19 | Minimum Annual Temperature | Min_Temp | 0.26 | 0.50 | 1.29 | 0.94 | 0.73 |
| 20 | Elevation | Ave_Height | 0.86 | 0.62 | 1.05 | 0.32 | 0.72 |
| 21 | Skid Resistance | SKIDRES | 0.26 | 0.51 | 0.67 | 1.11 | 0.62 |
| 22 | Maximum Annual Temperature | Max_Temp | 0.45 | 0.28 | 0.48 | 0.51 | 0.43 |
| 23 | Horizontal Road Markings | H sign | 0.15 | 0.26 | 0.22 | 0.39 | 0.25 |
The results shown in Table 1 indicate that the parameters related to pavement condition, route geometry, and longitudinal slope exert the most significant influence on the weighted accident index. Meanwhile, several factors such as horizontal markings, skid resistance, and climate-related variables show relatively low importance. Nevertheless, they remain integrated into the model due to their possible indirect or cumulative effect, helping ensure that the overall estimation remains comprehensive.
3.7 Formula for calculating the weighted accident index (Wi)
As part of the analysis of parameters affecting road safety, a formula has been developed to calculate the weighted accident index (Wi), taking into account the most influential factors identified through machine learning models. This formula quantifies the contribution of each parameter to the overall risk, allowing for better identification and prioritization of hazardous road segments.
The accident index is calculated using the following equation:
| \[Wi\ =\ (0.0002662\ \times\ PCI)\ +\ (0.0001527\ \times\ Ave_Inc)\ +\ (0.0001128\ \times\ Kr.Kar.)\ +\ (0.000798\ \times\ KON.NAK.)\ +\ (0.000625\ \times\ LIMIT)\ +\ (0.000549\ \times\ RDB_RUT)\ +\ (0.000485\ \times\ K.Int.P.T)\ +\ (0.000462\ \times\ PGDS)\ +\ (0.000459\ \times\ IRI)\ +\ (0.000333\ \times\ SSD_H)\] | (7) |
Where:
- Wi - Weighted Accident Index [points]
- PCI – Pavement Condition Index [points]
- Ave_Inc – Average longitudinal slope ∑in/n × 100 [%]
- Kr.Kar. – Curvature parameter ∑α/L × 1000 [°/m]
- KON.NAK. – Cross slope coefficient ∑nkk/L × 1000 [n/m]
- LIMIT – Speed limit [km/h]
- RDB_RUT – Transverse unevenness (rutting) [mm]
- K.Int.P.T – Intersections and toll stations (∑ni + ∑npt)/L × 1000 [n/m]
- PGDS – Annual average daily traffic [vehicles/day]
- IRI – International Roughness Index [m/km]
- SSD_H – Horizontal sight distance coefficient ∑nhk/L × 1000 [n/m]
Each parameter in the formula is assigned a weight based on its relative importance, as determined by previous statistical and machine learning analysis. These weights reflect the actual influence of each factor on accident risk and help to rank road segments accordingly.
In the following phase, the application of the formula enabled the calculation of the weighted index for each road segment. As illustrated in Figure 7, there is a visible correlation between the calculated and actual values of the weighted accident index, confirming the model’s predictive alignment.
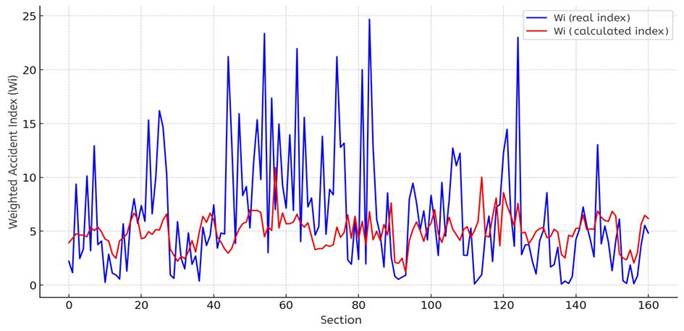
Fig. 7. Comparison between calculated and actual values of the weighted accident index
In terms of accuracy, the model yielded the following results:
- R² = 0.56 – indicating that 56% of the variation in the actual accident index is explained by the formula,
- MAE = 3.71 – the average absolute error between calculated and observed values,
- RMSE = 5.32 – reflecting higher deviations in some segments, particularly those with more extreme values.
While the RMSE suggests that discrepancies are larger in some road sections, the overall correlation (R² = 0.56) confirms the model’s ability to capture general patterns and trends. The formula can thus serve as a tool for identifying critical road sections and supporting future safety improvements. With further refinement of input parameters and weights, even higher accuracy may be achieved in subsequent applications.
3.8 Discussion of the results
The analysis of the results indicates that the developed model enables relatively accurate estimation of the Weighted Accident Index (Wi), achieving high prediction accuracy, particularly with the Gradient Boosting method (R² = 0.987). The observed deviations between the calculated and actual values (MAE = 2.95) are predominantly random and do not suggest the presence of any systematic errors in the methodology.
Compared to traditional statistical approaches such as Pearson correlation, which generally produce lower coefficients of determination, the application of machine learning methods demonstrates significant improvement. In addition to higher accuracy, these methods provide clearer identification of the key influencing factors on the index.
Three parameters stand out: pavement condition (PCI), average longitudinal slope (Ave_Inc), and curvature characteristics (Kr.Kar.), which have the highest weighted influence in the final formula. These results align with relevant international studies and confirm that improvements in road geometry and surface condition are critical to enhancing traffic safety.
Although the R² value of the proposed formula is moderate (0.56), when classified into five levels and mapped in GIS, the resulting spatial representation has an error margin of approximately 5–10%, which still allows for a satisfactory level of accuracy in identifying high-risk road segments.
From a practical standpoint, the results suggest that interventions focused on improving PCI values (above 75 points), optimizing longitudinal slopes (ideally under 6%), and refining horizontal alignment design can significantly contribute to reducing the Weighted Accident Index (Wi) across the road network.
4 Conclusions
The conducted research confirms that the application of machine learning is an appropriate and effective approach for evaluating the influence of road, traffic, and environmental parameters on the Weighted Accident Index (Wi). Through detailed analysis of 23 factors and weighted aggregation of the results from four models, a formula has been defined that allows for individual segment risk assessment.
The greatest influence on the index is attributed to parameters related to pavement condition, longitudinal slope, and horizontal geometry, directly pointing to potential directions for infrastructure improvements. The error analysis further confirms that the model is stable, with no systematic deviations, making it applicable for real-world scenarios.
Although some factors exhibit low individual impact, their inclusion in the model is justified due to potential cumulative or indirect effects under specific conditions. The formulated equation can serve as a basis for developing a mechanism for identifying high-risk road segments, as well as supporting decision-making processes related to road safety audits, design practices, and planning of safety interventions.
Acknowledgements
The author expresses sincere appreciation to the Faculty of Civil Engineering at the “Ss. Cyril and Methodius” University in Skopje for the institutional support during the research. Gratitude is also extended to the Public Enterprise for State Roads for granting access to road infrastructure data, and to the Ministry of Interior for providing traffic accident records. This research was carried out within the doctoral studies in Civil Engineering, study subprogram Transportation Engineering, in the field of Road Safety.
References
- World Health Organization. (2024). Road traffic injuries. Available at: https://www.who.int/news-room/fact-sheets/detail/road-traffic-injuries (accessed March 2025).
- European Commission. (2023). Road Safety Statistics 2023. Available at: https://road-safety.transport.ec.europa.eu/european-road-safety-observatory_en (accessed March 2025).
- State Statistical Office of the Republic of North Macedonia. (2025). MakStat - Statistical Database. Available at: https://makstat.stat.gov.mk/PXWeb/pxweb/en/ (accessed March 2025).
- Gonzalez-Hernandez, I., Pérez-Zuriaga, A., García, A., & Camacho-Torregrosa, F. J. (2024). In-built network-wide road safety assessment methodologies for rural roads. Accident Analysis & Prevention, 198, 107276. https://doi.org/10.1016/j.aap.2024.107276
- Paliotto, G., Fancello, G., & Pinna, F. (2024). Systematic review, evaluation and comparison of different approaches for the implementation of road network safety analysis. Sustainable Cities and Society, 99, 105400. https://doi.org/10.1016/j.scs.2023.105400
- Zhang, Y., Chen, W., Wang, Y., Wang, D., & Jiang, Y. (2024). A systematic review of the application and prospect of road accident blackspots identification approaches. Analytic Methods in Accident Research, 36, 100293. https://doi.org/10.1016/j.amar.2023.100293
- European Commission. (2023). EU Road Infrastructure Safety Management Guidelines. Available at: https://road-safety.transport.ec.europa.eu/eu-road-safety-policy/priorities/infrastructure/road-infrastructure-guidelines_en (accessed March 2025).
- Public Enterprise for State Roads. Web-GIS Platform for Spatial Analysis and Visualization. Available at: http://62.77.137.99/pesr/webgis/#/map (accessed March 2025).
- Ministry of Local Self-Government. (2021). Development Program for Planning Regions for the Period 2021–2026. Government of the Republic of North Macedonia, Skopje.
- Doncheva, R., & Ognjenović, S. (2024). Proektiranje patishta [Road Design]. Ss. Cyril and Methodius University – Faculty of Civil Engineering, Skopje. ISBN: 978-608-4510-60-4.
- Tobias, P., de León Izeppi, E., Flintsch, G., Katicha, S., McCarthy, R. (2023). Pavement Friction for Road Safety: Primer on Friction Measurement and Management Methods. Federal Highway Administration (FHWA), Report No. FHWA-SA-23-007.
- Public Enterprise for State Roads. Web-GIS Platform for Spatial Analysis and Visualization. Available at: http://tdps.roads.org.mk/ (accessed March 2025).
- Gjeshovska, V., Taseski, G., & Ilioski, B. (2024). Intensive Precipitation in the Republic of North Macedonia. Ss. Cyril and Methodius University – Faculty of Civil Engineering, Skopje. ISBN: 978-608-4510-56-7.
- Government of the Republic of North Macedonia, Ministry of Transport, Project Implementation Unit. (2024). Handbook on Black Spot Management (BSM). Skopje, July 2024.
- Murtagh, F., & Contreras, P. (2012). Algorithms for hierarchical clustering: an overview. Wiley Interdisciplinary Reviews: Data Mining and Knowledge Discovery, 2(1), 86–97. https://doi.org/10.1002/widm.53
- Trajkovski, V. (2016). How to Select Appropriate Statistical Test in Scientific Articles. Journal of Special Education and Rehabilitation, 17(3–4), 5–28. DOI: 10.19057/jser.2016.7.
- Ding, Y., Zhu, H., Chen, R., & Li, R. (2022). An Efficient AdaBoost Algorithm with the Multiple Thresholds Classification. Applied Sciences, 12(12), 5872. https://doi.org/10.3390/app12125872
- Kuhn, M., & Johnson, K. (2013). Applied Predictive Modeling. Springer Science+Business Media, New York. ISBN: 978-1-4614-6848-6.
- James, G., Witten, D., Hastie, T., & Tibshirani, R. (2013). An Introduction to Statistical Learning: with Applications in R. Springer, New York. https://doi.org/10.1007/978-1-4614-7138-7.
- Patil, P., Du, J.-H., & Kuchibhotla, A. K. (2022). Bagging in overparameterized learning: Risk characterization and risk monotonization. arXiv preprint arXiv:2210.11445. https://doi.org/10.48550/arXiv.2210.11445
- Zhao, C., Du, H., Liu, G., & Niyato, D. (2024). Supervised Score-Based Modeling by Gradient Boosting. arXiv preprint arXiv:2411.01159. https://doi.org/10.48550/arXiv.2411.01159
Conflict of Interest Statement
The authors declare no conflict of interest.
Author Contributions
Data Availability Statement
The datasets used and/or analyzed during the current study are not publicly available due to institutional restrictions but are available from the corresponding author on reasonable request.
Supplementary Materials
No supplementary materials are provided for this manuscript.