Volume 23 number 4 article 1310 pages 752-761
Received: Aug 17, 2025 Accepted: Nov 21, 2025 Available Online: Dec 14, 2025 Published: Dec 15, 2025
DOI: 10.5937/jaes0-60902
ASSESSMENT OF PROCESSING CAPACITY OF RAILWAY STATIONS BASED ON STATISTICAL ANALYSIS METHODS
Abstract
The purpose of the study is to improve the methods of assessing the processing capacity of railway stations based on scientific observation data. The paper considers a large private station that provides transport services to port terminals when performing railway and water transportation. The research is performed based on methods of analysis of time series and theory of operation of railways. The study established the maximum permissible volume of work for the port station and also assessed the impact of the combination of diverse types of goods on the amount of its processing capacity. The scientific novelty of the work is to improve the methods of evaluating the processing capacity of railway stations based on the methods of statistical data analysis. Unlike the existing method, the method allows you to more accurately consider local features of stations. The practical value of the results obtained is that they allow to predict the work of the station in the conditions of accidental flow of port terminals requests for servicing and avoid overload. This enables the station management to develop more efficient strategies for managing its work.
Highlights
- Developed a refined statistical method to assess railway station processing capacity.
- Demonstrated improved accuracy in assessing station processing capacity by incorporating local operational features, enabling stable operation with 25% higher wagon arrivals than planned.
- Created a capacity chart to optimize planning and prevent station overload, reducing overload risk to below 5% probability.
- Enabled efficient strategies for managing variable port terminal cargo flows, improving scheduling reliability for all terminals.
Keywords
Content
1 Introduction
Railway stations are one of the main elements of railway infrastructure. They provide direct connection of rail transport with the population, industry, construction complex, agriculture, and other modes of transport. Railway stations perform initial and final operations of the transport process: embarkation and disembarkation of passengers., loading and unloading of goods. The stations also perform control and maintenance of rolling stock and cargo during transportation. Railway stations are characterized by complex and diverse technological processes, some of which are performed in parallel and partially consistently. A comprehensive indicator that characterizes the ability of railway stations to perform the set volumes of work is their processing capacity. Reforming the railway transportation market has led to the emergence of independent railway operators such as Switching and Terminal Operators in the United States, Operators of Service Facilities in the EU competing for cargoes between themselves, stations of main railway network, as well as automobiles. Examples of private port railway infrastructure operators that have their own stations in Ukraine include Transinvestservice LLC, which serves the Sea Trade Port Pivdennyi, and in Kazakhstan, Kaskor-Transservice JSC, which serves the Aktau Sea Port. In their work, the operators of port stations interact with the managers of the main railway network, respectively, JSC Ukrzaliznytsia and JSC "NK Kazakstan temir zholy". The emergence of competition in the sphere of station services significantly increases the requirements for the assessment of the processing capacity of the stations and how the proposal of station operators to its customers is formed on its basis. Therefore, the problem of improving the methods of assessing the processing capacity of railway stations is relevant for rail transport. This paper is devoted to the problems of determining the processing capacity of stations that provide cargo transportation.
Railway stations are complex mass service systems with elements of station infrastructure, shunting locomotives and production staff. The external environment in relation to railway stations is the main railway network and freight terminals with which the station exchanges material and information flows. The input flow for railway station applications comprises cargoes, wagons, and containers arriving at the station, along with their supporting documents and information. The input flow for railway station is heterogeneous as it contains applications that require different service technologies. The output flow consists of cargoes, wagons, and containers departing from the station, as well as their supporting documents and information. Service apparatus are freight fronts, locomotives, employees of different specialties who process applications. In the general case, the railway stations are multi-channel and multi-phase systems, with some operations can be performed in parallel, and part sequentially. Railway stations are stochastic systems. The interval between the input flow applications, the types of applications that come from it, and the duration of their service are random values. Railway stations are ergatic systems. Station management is conducted by operative-dispatching staff, whose main task is to solve conflict situations and the choice of the order of service of applications. Considering this characteristic of stations, the task of determining the processing capacity of stations is a rather complex problem.
The emergence of methods for determining the processing capacity of stations occurred in the late 19th century. This was mainly due to the tasks of establishing the required technical parameters of railway stations when they have been projected. In the early 20th century, the reverse tasks also emerged, which were to determine the volume of work that the station with the available technical equipment could perform. The characteristic features of the methods of calculating the processing capacity of railway stations of the early 20th century were the use of analytical models to calculate the processing capacity of individual technical means and graphic models for the complex assessment of the processing capacity of stations. At the same time, the general expression for the analytical determination of processing capacity of technical means looked as follows
| (1) |
where n – stands for number of applications that can a technical tool work out during a day;
- T – stands for time of technical tool work during the day, min;
- ∑t – stands for total time spent to process a single application, min;
- a – stands for the coefficient of unevenness.
The processing capacity of railway stations is determined not only by the duration of technological operations, but also the rational distribution of technical tools of stations between diverse types of work and the magnitude of downtime in anticipation of technological operations. Analytical methods of the early 20th century did not allow to consider these features, so they were supplemented with graphic modelling in the form of construction of daily schedules. The problems of this method are related to the considerable cost of the decision and subjectivity of decisions, which depends on the person who performs graphic modelling.
The rapid development of mathematical methods of studying operations and analysis of time series, as well as computer equipment, which began in the 40s of the 20th century, ensured the creation of new tools to solve the problem of assessing the processing capacity of railway stations. Due to the development of mass service theory, it was possible to create analytical models to evaluate the waiting time for applications before servicing. Examples of solving such problems, in particular, are presented in the works by Rice [1], Hansen [2], Weik at al. [3]. The use of the mathematical apparatus of mass service theory makes it possible to establish the relationship between the number of shunting locomotives, service crews, processing capacity of sorting devices, the capacity of the section and the number of tracks at stations where the wagons are idle in anticipation of service. The disadvantages of models of railway stations based on analytical expressions of mass service systems are because they do not take into account the order of servicing applications on the operational performance of stations. Additional complexity is made by the fact that in solving practical problems engineering workers use generalized mathematical expressions, which do not consider all the local features of the work of stations. Clarification of these expressions requires research and involvement of researchers who have appropriate training in the field of applied mathematics. The following disadvantages reduce the accuracy of assessments of the processing capacity of stations. Therefore, analytical models are usually used at the stage of preliminary calculations.
The search for the optimal order of application service refers to the tasks of the Operations Research. Applied use of such methods to solve the problems of assessment of the processing capacity of railway stations is presented in works [4, 5, 6]. However, the methods presented provide the determination of the capacity of stations only in the conditions of trains on schedule with relatively simple technology of their operation.
The development of computer equipment and software has opened new opportunities to improve the methods of assessing the processing capacity of stations. Use for graphical modelling of work of universal graphic editors, such as AutoCAD, and specialized programs, for example Kozachenko et al. [7], allows to improve the quality of implementation of daily schedules, simplify the processes of their storage and duplication, automate the calculation of stations. However, the main work on building graphic models of stations is performed by a human and requires considerable time to get a solution.
The acceleration of the process of modelling of station processes is provided by simulation models [8-12]. Such models allow to simulate the functioning of railway stations with a high degree of compliance with real technological processes. Unlike analytical models, imitation models consider the wide range of feedback and operational restrictions that are inherent in stations. The choice of the optimal order of use of technical means in these models is conducted either since an algorithm that simulates the activity of operative-dispatching personnel [8-10], or by performing modelling under human guidance [11, 12]. The main problem that holds back the use of simulation modelling in the practical activity of railway transport is the considerable cost of funds and time to build adequate models at the initial stage and maintain its compliance in the operation of railway stations [13].
For railway transport operations, a well-established system of statistical support is essential, as its presence is a fundamental requirement for ensuring safety management, economic efficiency, strategic planning, and regulatory monitoring of the sector. In particular, the accumulation of statistical data and its effective processing are critically important for forecasting freight and passenger traffic volumes, as well as for assessing transportation safety [14, 15, 16]. The processing capacity of railway stations is influenced by a complex interplay of infrastructure conditions, operational practices, and energy efficiency. Recent research has shown that optimizing energy use in electric railway vehicles – particularly through regenerative braking – can significantly improve overall performance on key international corridors, such as the section between Hegyeshalom and Győr in Hungary [17]. At the same time, the mechanical quality of track infrastructure, including the properties of thermite weld joints and their heat-affected zones, plays a crucial role in maintaining safe and uninterrupted operations [18]. Track settlement under dynamic loading is another critical factor, as it directly affects ride quality, maintenance needs, and the long-term stability of ballasted tracks [19]. Together, these elements highlight the need for data-driven methods to assess and manage station-level capacity. By applying statistical analysis to operational and infrastructure-related data, it becomes possible to identify bottlenecks, forecast degradation, and support more effective decision-making for railway network planning and station management.
Considering that railway transport represents a complex system whose performance indicators depend on the interaction of numerous external and internal factors, statistical tools offer an effective means of studying these relationships. Such tools can be applied even when complete information about the internal organization of the system and its underlying processes is not available. Examples of research in this area include the application of the Gray-DEA method to evaluate the operational efficiency of shunting locomotives in the work of Zhang et al. [20], as well as the use of regression analysis to quantitatively assess the influence of key factors on line capacity in the study by Rahoma et al. [21].
Scientific methods of assessing the processing capacity of stations are the basis for regulatory documents that determine the procedure for their production and development of technology. The normative documents currently in Ukraine and Kazakhstan provide for the implementation of analytical calculations of the processing capacity of individual elements and a comprehensive verification of the interaction of these elements because of graphic modelling. Simulation models remain cumbersome and are used as an additional method in individual project work. The frequency of reassessment of processing capacity of railway stations of the public network is once every 10 years. Information regarding the processing capacity of stations is used for the optimal distribution of transportation volumes across the railway network. As a result of reforms, private railway stations began to provide their services in the railway market. Private stations work in the context of interaction and competition with other transport services suppliers and are characterized by rapid changes in the volume and nature of the wagon’s flows. Market reforms have allowed railway stations to quickly change their technical equipment by attracting the shunting locomotives of locomotive traction operators. In such circumstances, the assessment of processing capacity for private stations has become one of the tasks of current planning and the need for its solution arises once or twice a year. It is also important for private stations to consider the local features of their work as processing capacity determines the number of services they can provide to their customers.
In today's context, a considerable amount of reporting data on the results of their work is documented and accumulated railway stations. This allows you to develop methods for evaluating the processing capacity of railway stations based on systematic, purposeful, planned and deliberate observation of their functioning.
The analysis shows that the existing methods for assessing station capacity are rather labor-intensive to apply and are primarily oriented toward medium- and long-term planning tasks. At the same time, there is a research gap related to the absence of methods for evaluating station capacity on the basis of actually achieved operational results, which would be useful for short-term planning. The purpose of this paper is to improve the methods of assessing the processing capacity of railway stations based on statistical methods.
2 Materials and methods
Railway stations and freight terminals are complex systems that perform operations with cargoes, wagons, and trains with the help of technical means and staff. These operations include maintenance, fixing, disbanding of train composition, rolling stock brakes check and other operations conducted in accordance with the established rules.
This research uses the statistics of the operation of the Chimichna from 2019 to 2021. The general scheme of the station is shown in Fig. 1.
The track development of the station includes a receiving and departure yard and four cargo yards. The station provides transport services to port operators (stevedoring companies). The terminals have the following specialization:
- a, b, c – corn unloading;
- d – unloading of iron ore raw materials;
- e – unloading of iron ore raw material, coal loading;
- f – unloading containers and ferrous metals, loading of containers and coal.
The main purpose of the Chimichna station is to ensure the execution of cargo operations of loading and unloading. The characteristics of the productivity of the station is the processing capacity - the highest number of cargo wagons, which can be processed by it per day, provided that advanced technology, the best use of track development and technical equipment. In this study, the processing capacity of the station is evaluated by the number of accepted and sent loaded wagons per day, which corresponds to the number of cargo operations performed by it.
The stevedoring services market is characterized by an important level of competition. Accordingly, the volume of work that attract individual station terminals are random values. The maximum volume of wagon supply to the station is regulated by the contract between the main railway network manager and the station operator. They make up
Nex =1815 wagons per day. The amount of Nex is determined based on the section capacity that connects the station to the public railway network. The implementation of the provisions of the contract is conducted by limiting the volume of acceptance of wagons that follow the station. Because of different time of movement of wagons from the departure stations to the port station, the actual arrival volumes may insignificantly exceed the Nex value.
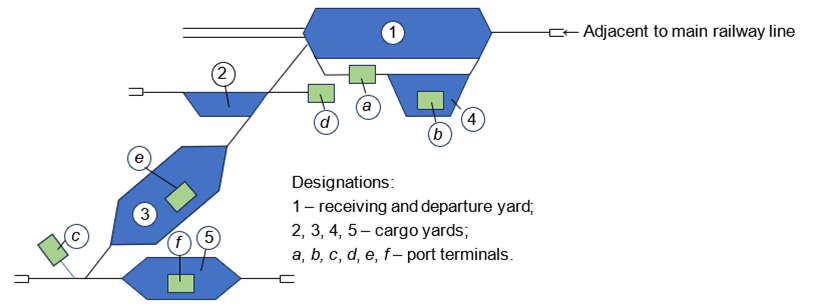
Fig. 1. General scheme of the station
The maximum volume of wagon supply to the station is redistributed between terminal operators so that
| Nex ≥ Ntr,i + No, | (2) |
where Ntr,i is maximum daily volumes of wagons on the i-th terminal;
No is daily volumes of wagons supply with household goods for their own needs.
In addition to the section capacity another factor that limits the volume of transport services to the terminals, is the capacity of the station. The volume of wagons in the station is a random value that has a distribution close to normal. The histogram and the density of the distribution of the random variable of the number of performed cargo operations at the station during the day is shown in Fig. 2.

Fig. 2. Histogram and the density of the distribution of the random variable of the number of performed cargo operations at the station during the day
The cause of unevenness is seasonal and daily fluctuations in transportation. Seasonal fluctuations are associated with changes in the conditions in commodity markets, served by the station, as well as a significant fate of agricultural cargoes in its cargo flow. Daily unevenness is caused by such reasons as the probabilistic process of train formation, the irregularity of supplying empty wagons under load, the performance of maintenance work on the railway, the features of the mode of operation of the loading enterprises and others. The average daily volume of cargo operations performed by the station during 2019-2021 amounted to 1143 wagons. The maximum volume of cargo operations performed by the Chimichna station was observed on July 16, 2020 and amounted to 2113 cars per day. However, this value cannot be used as an assessment of the station processing capacity for two reasons.
The first reason that necessitates the processing of observations in the assessment of the processing capacity of stations is the specific conditions of their work in overload. For example, Fig. 3 shows the dynamics of the volume of cargo operations at the Chimichna station in the month of the largest transportation.
The largest value of the processing of wagons observed on July 14 and 16, 2020 was preceded by the minimum values of wagon processing on July 13 and July 15.
Wagon processing at the station is a process that is distributed over time. At the same time, the smoothing of daily unevenness is partially performed by the reserve of processing capacity of the station, and partly at the expense of additional track capacity, which provides idle wagons in anticipation of service. Therefore, the peak volumes of arrival and departure of loaded wagons were not the processing of the carriage, but only filling the stations of the station arriving, as well as the release of tracks from wagons that were previously processed and expected departure. In order to limit the impact of random fluctuations of wagon flow on the assessment of the value of the processing capacity of the station, it is proposed to perform averaging the volume of work performed in several consecutive days.
Such an assessment of the processing capacity of the station corresponds to the maximum value of the smoothed time row using the method of simple sliding average in ten periods.
| (3) |
where ni – stands for volumes of arrival of wagons during the i-th day;
- T – stands for the smoothing period;
- k – number of values of the original function to calculate the sliding average, days.
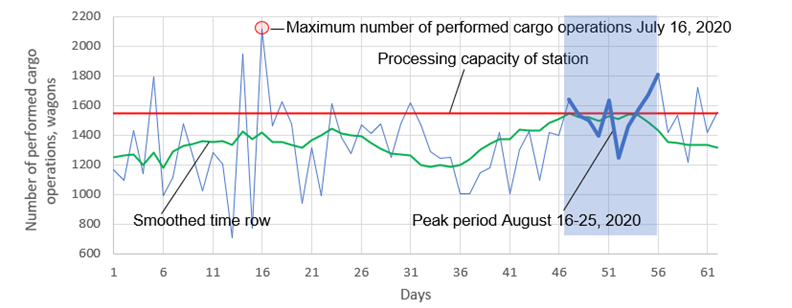
Fig. 3. Dynamics of cargo work of the Chimichna station in the months of maximum transportation (July-August 2020)
At the same time, in some days the volumes of general arrival and departure of loaded wagons may be recorded in excess of processing capacity, but such events should rarely occur. The number of values of the original function for calculating the sliding average k on one side should be sufficient to exclude short-term fluctuations in the volume of arrival and departure of wagons, and on the other – as little as possible as the periods of work of the station in the conditions of maximum load are short-lived. The dependence between the value of k and the assessment of the processing capacity of the station is shown in Fig. 4.
The study adopted the threshold of the probability of exceeding the daily processing capacity of 0.05. The analysis of the empirical function of the distribution of the random variable of the implemented processing capacity of the station shows that such a threshold corresponds to the processing capacity of 1545 wagons per day. Close to this value is achieved at k=10 days, with the processing capacity of the Nst, max is estimated at 1546 cars per day. This level of processing capacity of the station was achieved between July 16 and 25, 2020 (the period from 47 to 56 days in Fig. 3).
The second reason, which necessitates the processing of observations in the assessment of the processing capacity of stations is the multidimensional nature of the time series, which characterizes the volume of work of stations. The duration of occupation of shunting locomotives and infrastructure by wagons when performing cargo operations with different cargoes is significantly different. In this study, two separate groups of cars are highlighted:
- wagons with iron ore raw materials arriving by trains loaded with one cargo;
- wagons with other cargoes (corn, ferrous metals, containers, coal, and other cargoes) that require sorting and accumulation before supply to freight fronts.
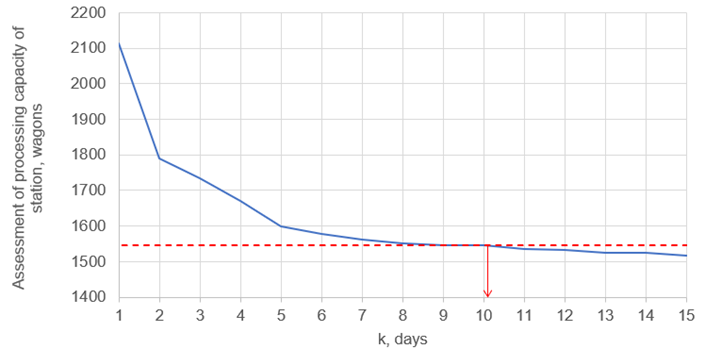
Fig. 4. The dependence between the value of k and the assessment of the processing capacity of the station
Given that diverse types of wagons in the processing process at the station use the same technical means, the maximum volumes of their processing are interrelated. To detect the connections between the volumes of processing of wagons with different cargoes a chart of processing capacity of the station is built in Fig. 5. In the process of analysis on the coordinate plane, the values of the implemented processing capacity of the station for 10 consecutive days are marked, with the abscissas corresponding to the average number of unloaded wagons with iron ore raw materials, and ordinates – the number of cargo operations with other cargoes.
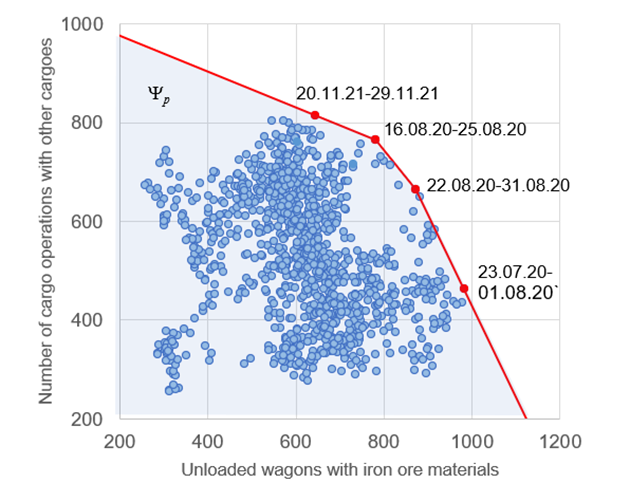
Fig. 5. The field of points that characterizes the station implemented by the processing capacity of the station
In the set of points obtained according to the observations of points, there are a set of alternatives that cannot be improved – the Pareto set. On the basis of these points, the boundary of the region of Yp is formed, which characterizes the implemented station processing capacity. This limit is shown in Fig. 5, red line.
3 Results and discussion
According to the results of the analysis of the field of points presented in Fig. 5 the area of Wp is highlighted, which characterizes the processing capacity of the station during the month. Restrictions 1, 2 and 3 are built on the basis of the boundary of the region Yp, taking into account the coefficient of 0.93, which reflects the monthly uneven transportation. These restrictions are related to the need to use the receiving and departure yard to perform additional operations when overloading the station with wagons with individual goods. In particular, as the volume of unloading of iron ore raw materials increases, there is a need to use the track capacity of the receiving and departure yard for idle wagons in anticipation of the supply to the freight fronts of terminals d and e; as freight work with other goods increases, the receiving and departure yard is used for pre-selection of wagons on the freight fronts a, b, c, e and f. Restriction 4 corresponds to the overall processing capacity of the freight fronts to unload iron ore raw materials of terminals d and e.
In general, the processing capacity of the station is determined by a system of restrictions
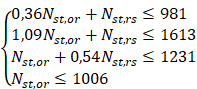 |
(4) |
![]() is monthly volume of cargo operations with corn, ferrous metals, containers, coal, and other cargoes.
is monthly volume of cargo operations with corn, ferrous metals, containers, coal, and other cargoes.
The normative values of the productivity of shunting locomotives determine the corresponding restrictions of the processing capacity of the station and divide the area of Wp into strips. The calculation of the locomotive fleet can be performed in accordance with the methodology presented in [22]. The obtained diagram of the processing capacity of the station is shown in Fig. 6.
Fig. 6. Chart station processing capacity
Comparison of the processing capacity obtained on the basis of a smoothing of the processing capacity of 1546 cars per day and given in the technological process of the station of the estimated daily processing capacity of 1234 wagons per day shows that the station is able to work steadily with increasing by 25% of the arrival of cars. The main reason for the increase in the processing capacity of the station is the significantly greater rate of wagons with iron ore raw materials in the actual wagon flow compared to the planned. Therefore, the assessment of processing capacity based on smoothing the time row of arrival of wagons is only permissible when the station processes mainly the same cargo.
The station capacity processing diagram is a more effective tool for the current planning of its work than traditional assessment in the form of a single value in the technological process. When performing an analysis based on a chart of the routine volume of work within the region Wp, it means that they are acceptable, since the station in the previous period of time has already coped with similar volumes of work. In this case, their mastery is associated with the involvement of sufficient number of shunting locomotives. When planned volumes of work exceed the region Wp , it requires a procedure to coordinate applications of terminals for the transport of service and adjustment of plans for the supply of goods for their own needs. The development of work volumes outside the Wp requires preliminary risk analysis and preparing of technical means and staff training. As a rule, risks are economical and are associated with an increase in the cost of using wagons and increasing penalties due to the delay in receiving trains from the main network. Changing the system of restrictions of the region Wp is possible only after evaluating the achieved traffic safety indicators during periods of overload and confirming their finding within the threshold values.
For the considered station, the value of its processing capacity for the estimated using the traditional methodology based on ratio of the volume of work of terminals is marked by А and is within the area Wp (see Fig. 6). The distance from point A to restriction 2 characterizes the presence of an overload of the station in separate periods of time, reaching 9%. Markers in Fig. 6 indicate the average daily volume of work per month 2019-2021. The accumulation of 10 of 36 observed volumes of work near restrictions 1-3 indicates the need to develop reconstructive measures to increase the processing capacity of the station.
The scientific novelty of the work is to improve the methods of evaluating the processing capacity of railway stations based on the methods of statistical data analysis. Unlike the existing method, the method described allows you to more accurately consider local features of stations. The developed statistical methods for assessing processing capacity can be effectively applied to railway stations handling freight traffic with a random arrival flow.
The practical value of the results obtained is that they allow to predict the work of the station in the conditions of accidental applications flow of port terminals for service and avoid overload. This enables the station management to develop more efficient strategies for managing its work.
4 Conclusions
1) Market reforms occurring in the field of railway services have led to the emergence of private stations, the operation of which is conducted at the expense of payment for the transport services they provide to the cargo owners. In such circumstances, the processing capacity of the stations determines the number of services they can provide to their customers. Since current planning needs to systematically evaluate the compliance of technical equipment of stations with the planned volume of work, there is a need to improve the methods of determining their processing capacity.
2) For the predominantly identical cargo stations, it is possible to evaluate processing capacity based on the observations of the results of smoothing the time series of arrival of wagons with a period of 10 days. Exceeding in some days of certain processing capacity are rare events and are related to the peculiarities of filling the track capacity of the stations during the overload.
3) Technical equipment of different cargo stations is proposed to be characterized using processing charts. The diagram is a system of restrictions built based on the observation data on the station under different conditions. The use of the chart allows you to evaluate the planned volumes of work of the technical equipment of the station, as well as to record the overload of the station and the need to conduct work on enhancement of processing capacity.
Acknowledgements
The authors declare that no funds, grants, or other support were received during the preparation of this research.
References
Rice, P. (1976). A Queueing Theory Approach to Railway Capacity in Urban Commuter Railways. IFAC Proceedings Volumes, 9(4), 267-276. https://doi.org/10.1016/s1474-6670(17)67303-8
Hansen, L. Station capacity and stability of train operations. (2000). Computers in Railways VII, WIT Press, Southampton (2000), pp. 809-816. https://www.witpress.com/elibrary/wit-transactions-on-the-built-environment/50/4164
Weik, N., Niebel, N., & Nießen, N. (2016). Capacity analysis of railway lines in Germany – A rigorous discussion of the queueing-based approach. Journal of Rail Transport Planning & Management, 6(2), 99-115. https://doi.org/10.1016/j.jrtpm.2016.06.001
Lindner, T. (2011). Applicability of the analytical UIC Code 406 compression method for evaluating line and station capacity. Journal of Rail Transport Planning & Management, 1(1), 49-57. https://doi.org/10.1016/j.jrtpm.2011.09.002
Kavička, A., Diviš, R., & Veselý, P. (2020). Railway station capacity assessment utilizing simulation-based techniques and the UIC406 method. Proceedings of the 32nd European Modeling & Simulation Symposium (EMSS 2020), 41-49. https://doi.org/10.46354/i3m.2020.emss.007
Jovanović, P., Pavlović, N., Belošević, I., & Milinković, S. (2020). Graph coloring-based approach for railway station design analysis and capacity determination. European Journal of Operational Research, 287(1), 348-360. https://doi.org/10.1016/j.ejor.2020.04.057
Kozachenko, D., Verlan, A., & Korobyova, R. (2020). Improvement of graphical model of railway stations functioning. 2020 International Conference on Decision Aid Sciences and Application (DASA), 395-398. https://doi.org/10.1109/dasa51403.2020.9317139
Luteberget, B., Claessen, K., Johansen, C., & Steffen, M. (2021). SAT modulo discrete event simulation applied to railway design capacity analysis. Formal Methods in System Design, 57(2), 211-245. https://doi.org/10.1007/s10703-021-00368-2
Vincze, R., Karovič, V., & Kavalets, I. (2022). The Efficiency of Transport-Management in the E-logistics Marketplace. Developments in Information & Knowledge Management for Business Applications, 239–255. https://doi.org/10.1007/978-3-030-95813-8_11
Caramuta, C., Longo, G., Montrone, T., & Poloni, C. (2021). An Integrated Methodology for the Multi-Objective Optimization of Port Railway Capacity: The Case Study of the Port of Trieste. Sustainability, 13(19), 10490. https://doi.org/10.3390/su131910490
Malovichko, V. V., Malovichko, N. V., & Rybalka, R. V. (2024). Creation of a Mathematical Model of a Stationary Rail Circuit in the Form of a Finite Discrete Automaton. Science and Progress in Transport, 2(106), 5–11. https://doi.org/10.15802/stp2024/306138
Janota, A., Pirník, R., Ždánsky, J., & Nagy, P. (2022). Human Factor Analysis of the Railway Traffic Operators. Machines, 10(9), 820. https://doi.org/10.3390/machines10090820
Taran, I., Bikhimova, G., Danchuk, V., Toktamyssova, A., Tursymbekova, Z., & Oliskevych, M. (2024). Improving the methodology for optimizing multimodal transportation delivery routes and cyclic schedules in a transnational direction. Transport Problems, 19(1), 157-170. https://doi.org/10.20858/tp.2024.19.1.13
Yang, Y., & Yu, C. (2015) Prediction models based on multivariate statistical methods and their applications for predicting railway freight volume, Neurocomputing, 158, 210-215. https://doi.org/10.1016/j.neucom.2015.01.046
Macioszek, E. (2021) Analysis of the volume of passengers and cargo in rail and road transport in Poland in 2009-2019. Scientific Journal of Silesian University of Technology. Series Transport., 113, 133-143. https://doi.org/10.20858/sjsutst.2021.113.10
Kyriakidis, M., Pak, K. T., & Majumdar, A. (2015). Railway Accidents Caused by Human Error: Historic Analysis of UK Railways, 1945 to 2012: Historic Analysis of UK Railways, 1945 to 2012. Transportation Research Record: Journal of the Transportation Research Board, 2476(1), 126-136. https://doi.org/10.3141/2476-17
Fischer, S., & Kocsis Szürke, S. (2023). Detection process of energy loss in electric railway vehicles. Facta Universitatis, Series: Mechanical Engineering, 21(1), 081. https://doi.org/10.22190/fume221104046f
Fischer, S., Harangozó, D., Németh, D., Kocsis, B., Sysyn, M., Kurhan, D., & Brautigam, A. (2024). Investigation of heat-affected zones of thermite rail weldings. Facta Universitatis, Series: Mechanical Engineering, 689. https://doi.org/10.22190/fume221217008f
Fischer, S. (2024). Investigation of the Settlement Behavior of Ballasted Railway Tracks Due to Dynamic Loading. Spectrum of Mechanical Engineering and Operational Research, 2(1), 24-46. https://doi.org/10.31181/smeor21202528
Zhang, Y., Lei, D., Li, X., & Fu, Y. (2013). The analysis of shunting locomotives’ operating efficiency based on gray-DEA. Research Journal of Applied Sciences, Engineering and Technology, 5(5), 1720-1725. http://dx.doi.org/10.19026/rjaset.5.4927
Rahoma, D. M., Heikal, A. Z., Haytham, N. Z., & Kotb, A. S. (2021). Proposed models to calculate and optimise line capacity under different operation conditions for Egyptian railway network. Journal of Applied Engineering Science, 19(1), 77-83. https://doi.org/10.5937/jaes0-27821
Verlan, A., Berezovy, M., Vernyhora, R,, & Shepeta, A. (2013). To the question of the design procedure of working park of shunting locomotives of the access road. Transport Systems and Transportation Technologies, (3), 15-19. http://tstt.diit.edu.ua/article/view/17180
Conflict of Interest Statement
All authors declare that they have no conflicts of interest.
Data Availability Statement
There is no dataset associated with the study or data is not shared
Supplementary Materials
There are no supplementary materials to include.