Volume 23 number 3 article 1283 pages 405-420
Received: Sep 09, 2024 Accepted: Jul 08, 2025 Available Online: Aug 26, 2025 Published: Sep 15, 2025
DOI: 10.5937/jaes0-53319
COMPARATIVE DYNAMIC ANALYSIS OF RCC AND COMPOSITE HIGH-RISE BUILDINGS FOR LATERAL FORCES
Highlights
- Structural behaviour of regular and vertical geometric irregular high-rise buildings considering RCC and composite concrete elements (columns, beams and slabs) is evaluated for lateral forces.
- Critical differences in the performance of RCC and composite structures are identified by analyzing key parameters such as storey drift, storey stiffness, storey displacement and base shear to evaluate the structural response to lateral forces.
- Each structural element has been considered as composite in combination with conventional RCC element to check their behaviour to lateral forces and to arrive at the best performing combination.
Nomenclature
RCC – Reinforced cement concrete
CEIS – Concrete encased I section
CESIS – Concrete encased similar I section
CEDIS – Concrete encased different I section
RBS – beam and slab.
Keywords
Content
1 Introduction
The construction landscape is predominantly characterized by reinforced concrete (RC) members in low-rise buildings due to their economic advantages. However, rapid urban population growth and limited land availability have increased the demand for mid to high-rise buildings. To meet this demand, composite construction, which combines advantages of steel and concrete, is emerging as a more efficient and cost-effective alternative to the conventional RC construction (Divya & Murali, 2021). RCC members, while prone to buckling, experience creep and shrinkage over time, which can affect long-term stability and performance. Conversely, steel members, composed of slender plate elements, are susceptible to local and lateral buckling, which can compromise structural integrity during wind and seismic events. Composite structures synergistically combine the strengths of concrete and steel, making them ideal for high-rise buildings by effectively sharing forces between the two materials. Thus, composite structures offer enhanced energy dissipation, better performance under lateral forces, and economical design.
Regular buildings experience minimum disruptions as compared to irregular buildings. Vertical irregularity either in plan or in elevation due to mass, stiffness and/or geometry reduces the ability of the building to withstand lateral forces, thus compromising structural integration. Building’s response to lateral forces is significantly influenced by vertical geometric irregularity (Sandeep et al., 2024). As per Indian standard code IS 1893 (Part 1):2016, “A building is considered to have a vertical geometric irregularity when the horizontal dimension of the lateral force-resisting system in any storey exceeds 125% of the storey below”. Also, code suggests for dynamic analysis if vertical geometric irregular buildings are in higher seismic zones. In the present study, dynamic analysis is performed on RCC and composite buildings of regular and vertical geometric buildings to compare their dynamic response to lateral forces.
Considerable studies have been done that are dedicated to the seismic and structural behaviour of high-rise RCC, steel, and composite buildings. Composite columns, like concrete-filled steel tubes and encased sections, provide robust support, efficiently handling axial compression and buckling, thus enhancing structural performance (Farajpourbonab et al., 2018). The impact of vertical irregularities on seismic stability has been assessed to provide a comprehensive understanding of building performance under earthquake conditions (Tomer & Bhandari, 2023). (Zaveri et al., 2016) conducted research comparing RCC, steel and composite lows rise structures in seismic conditions, and concluded the RCC is preferred for low rise due to its stiffness and cost-efficacy. (Chaudhary and Khan, 2021) analyzed composite systems for high-rise structures, identifying that they provide high ductility and strength. The weight/strength ratio of RCC structure is high, making them less suitable for super high-rise buildings with large shear forces (Wang et al., 2023). Steel–concrete composites are having higher load-carrying capacity, high stiffness, and a durative system; hence they find valuable application for high-rise buildings (Xue, Yang & Yu, 2019). Composite structures can be more complex to construct, especially with cast-in-place methods, but they provide better efficiency and quality when using precast components (Xue, Yang & Yu, 2019).
Composite structures have superior performance over conventional RCC in high-rise buildings under seismic loads. (Singh et al., 2024) conducted a dynamic analysis of various lateral load-resisting systems in a G+16 RCC building, identifying the diagrid system as most effective for seismic performance. (Laddha et al., 2021) analytically compared RCC and composite G+7 buildings, concluding that composite systems reduce self-weight and increase ductility, making them preferable. (Phatale and Parekar, 2019) compared RCC, steel, and composite G+8 frames and found composite structures performed better in resisting lateral loads. (Zhang and Zhang, 2024) introduced a novel plastic deformation method for nonlinear seismic analysis of RCC and composite structures, proving the composite model had better durability and energy absorption under both common and rare earthquakes. A comparative investigation was carried out by (Abhijeet et al., 2021) to analyze the dynamic performance of steel, RCC, and composite moment-resisting frames under seismic loading conditions and concluded that composite structures are economical.
In the present study, (G+25) storey regular building and building with vertical geometric irregularity considering RCC and composite concrete encased I-section elements (columns, beams and slabs) are modelled and analyzed using Extended Three-Dimensional Analysis of Building system (ETABS 2021) software for wind and seismic parameters as per IS 875 (Part 3):2015 and IS 1893 (Part 1):2016 respectively. The study aims to identify critical differences in the performance of RCC and composite structures by analyzing key parameters such as storey drift, storey stiffness, storey displacement and base shear to evaluate the structural response to lateral forces. Unlike previously available studies, each structural element has been considered as composite in combination with conventional RCC element to check their behaviour to lateral forces and to arrive at the best performing combination.
2 Materials and methods
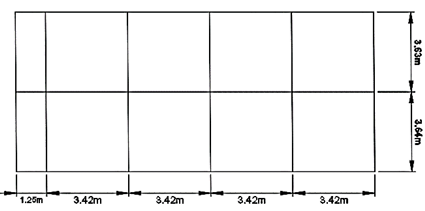
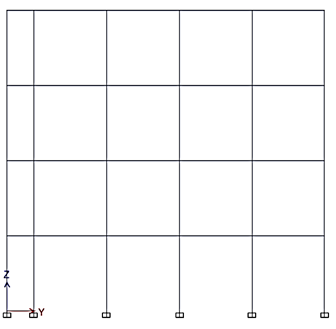
The study aims to provide the response of RCC and composite structures under seismic and wind loads. (G+3) storey structure has been considered for preliminary checks while (G+25) storey structure has been considered for actual comparative analysis for lateral loads. Fig. 1 shows plan and elevation of (G+3) storey model considered in the study. Fig. 2 and Fig. 3 show plan view and elevations of (G+25) structural models with regular and vertical irregular structures respectively considered in the study. Methodology adopted for the study is depicted in Fig. 4. Reference models, Model-1, 4 and 7 consist of conventional RCC columns, beams, and slabs, while the comparative composite models, Model - 2, 3, 5, 6, 7, 8, 9, and 10 incorporate composite columns, beams, and slabs in various combinations. Composite structures are modelled as per IS 11384:2022.
(a)
(b)
Fig. 1. (G+3) Storey Building model (a) Plan (b) Elevation
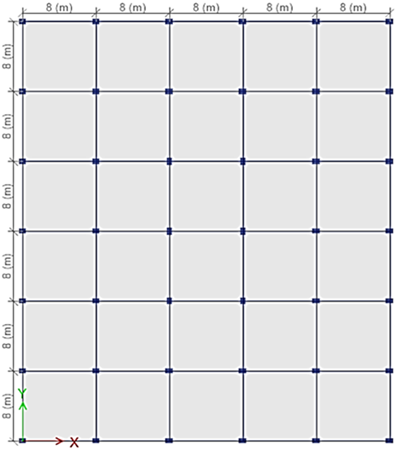
Fig. 2. Plan View of (G+25) Storey regular and vertical geometric irregular building models
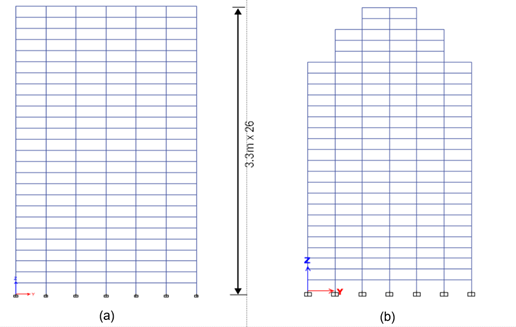
Fig. 3. Elevation of G+25 Storey Building model (a) Regular building (b) Vertically irregular building
Table 1. Geometric specifications of structural elements considered in the study
|
Building type |
Model |
Column |
Beam |
Slab |
|
(G+3) storey building |
Model-1 (RC-CB) |
RCC (400X500) |
RCC (300X400) |
RCC 150 thick |
|
Model-2 (EN-300SB) |
Concrete encased ISMB 300 |
Steel beam (ISMB 300) |
Composite Deck slab 150 thick |
|
|
Model-3 (EN-300CB) |
Concrete encased ISMB 300 |
RCC (300X400) |
Composite Deck slab 150 thick |
|
|
(G+25) storey building |
Model-4 (RC-CB) |
RCC (600X800) |
RCC (500X600) |
RCC 150 thick |
|
Model-5 (EN-600CB) |
CEIS (Concrete encased ISMB 600) |
RCC (500X600) |
Composite Deck slab 150 thick |
|
|
Model-6 (EN-I600C, RBS) |
CEIS (Concrete encased ISMB 600) |
RCC (500X600) |
RCC 150 thick |
|
|
(G+25) storey building with vertical geometric irregularity |
Model-7 (RC-CB) |
RCC (600X800) |
RCC (500X600) |
RCC 150 thick |
|
Model-8 (EN-I600C, RBS) |
CEIS (Concrete encased ISMB 600) |
RCC (500X600) |
RCC 150 thick |
|
|
Model-9 (EN-I400x400C) |
CESIS (Concrete encased double I-sections of ISMB 400) |
RCC (500X600) |
RCC 150 thick |
|
|
Model-10 (EN-I600x400C,RBS) |
CEDIS (Concrete encased double I-sections with one ISMB 600 and one ISMB 400) |
RCC (500X600) |
RCC 150 thick |
*All dimensions are in mm
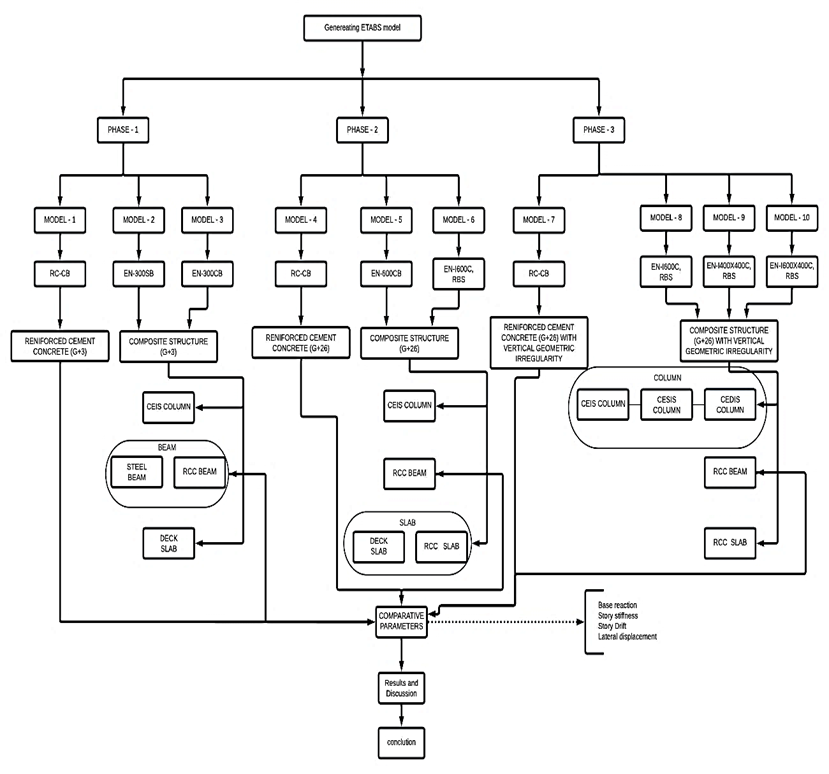
Fig. 4. Methodology of the study
The study has been divided into three phases focusing on the type of three key structural elements considered: columns, beams, and slabs. Typical Column, beam and slab sections considered in the study are shown in Fig. 5. Geometric specifications of structural elements considered are tabulated in Table 1. Phase-1 focuses on (G+3) storey building models (Model – 1, 2 and 3) to evaluate their structural behaviour for preliminary checks. Conventional RCC building labelled as RC-CB (building with conventional RCC beam, column and slab), and Composite buildings with two configurations are considered. EN-300SB (building with Concrete encased ISMB 300 column, ISMB 300 steel beam and composite deck slab) and EN-300CB (building with concrete encased ISMB 300 column, RCC beam and composite deck slab) are adopted. Phase-2 focuses on evaluating the structural behaviour of (G+25) storey building models (Model – 4, 5 and 6) based on the performance of building models from phase-1 by considering RC-CB, and composite buildings with concrete encased I-section columns. Two configurations of composite building models i.e., EN-600CB (building with concrete encased ISMB 600 column, RCC beam, and composite deck Slab) and EN-I600C, RBS (concrete encased ISMB 600 column, RCC beam and RCC slab) are adopted. Phase-3 focuses on evaluating (G+25) storey building models (Model – 7, 8, 9 and 10) with vertical geometric irregularity and four distinct composite element configurations. The first configuration is a conventional RC-CB building. Second configuration, EN-I600C, RBS, is RCC composite building with concrete encased I-section columns, specifically using ISMB 600 sections, and RCC beams and RCC slabs. Third configuration, EN-I400x400C, RBS, is RCC composite building with concrete encased double I-section columns using two ISMB 400 sections. Beams and slabs are of RCC. Fourth configuration, EN-I600x400C, RBS, consists of concrete encased double I-section columns with one ISMB 600 and one ISMB 400 sections. Beams and slabs are of RCC. The use of different I-section sizes and combinations allows for tailored solutions to meet specific structural requirements. For all the building models, M30 grade of concrete, Fe 500 grade steel for longitudinal reinforcement and Fe415 grade steel for transverse reinforcement has been adopted.
|
(a) Typical CEIS (Concrete encased I-section). |
(b) Typical steel beam (ISMB) |
|
(c) Typical composite slab. |
(d) Typical CESIS (Concrete encased similar I-section) |
|
|
(e) Typical CEDIS (Concrete encased Different I-section). |
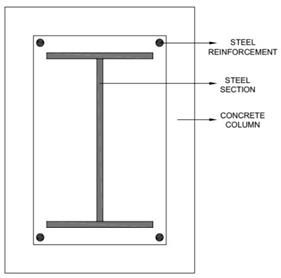
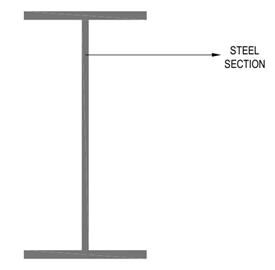
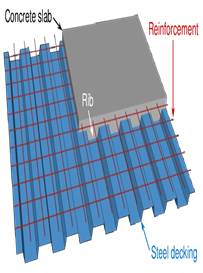
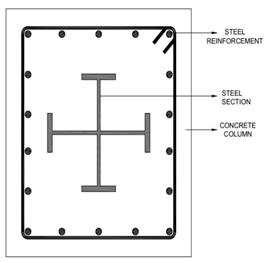
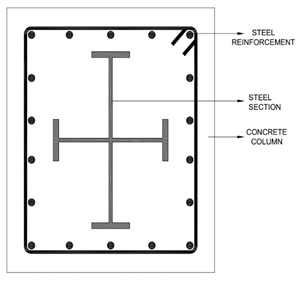
Fig. 5. Typical structural element (Column, beam and slab) sections considered in the study
ETABS models are analyzed for wind and seismic parameters as per IS 875 (Part 3):2015 and IS 1893 (Part 1):2016 respectively and key performance indicators such as storey drift, storey displacement, storey stiffness and base shear values are compared for RCC and composite building models to determine the structural efficiency of each model. Loads and parameters considered for modelling RCC, and composite buildings are tabulated in Table 2 along with relevant Indian Standard codes. Preliminary lower storey buildings are considered to verify modelling accuracy and to understand structural behaviour, thereby ensuring better precision and reliability when transitioning to high-rise buildings.
Table 2. Loads and parameters considered for modelling RCC and composite buildings
|
Load /Parameter |
Reference code |
||
|
Dead Loads |
Floor finish |
2.5 kN/m² |
IS 875 (Part 1): 1987 |
|
Masonry wall |
11.6 kN/m (applied on all beams) |
IS 875 (Part 1): 1987 |
|
|
Live Loads |
Live load |
5 kN/m² |
IS 875 (Part 2): 1987 |
|
Earthquake parameters |
Seismic zone |
III |
IS 1893 (Part 1): 2016 |
|
Soil type |
Medium soil |
||
|
Importance factor |
1.2 |
||
|
Response reduction factor |
5 |
||
|
Wind parameters |
Wind speed |
39 m/s |
IS 875 (Part 3): 2015 |
|
Terrain category |
3 |
||
|
Windward coefficient |
0.8 |
||
|
Leeward coefficient |
0.25 |
||
3 Results and Discussion
RCC and Composite Models, 1 to 10 are analysed for seismic and wind forces in 3 phases and base shear, story stiffness, story drift and story displacements are compared. Models 1 to 3 are considered for preliminary checks while Models 4 to 10 are considered for comparative analysis.
3.1 Phase-1
Phase-1 involves preliminary analysis of (G+3) storey building models, Model – 1, 2 and 3 to evaluate base reactions, storey stiffness, storey drifts and storey displacements for lateral forces in both x and y directions. Conventional RCC and two configurations of composite building models are considered for the analysis.
|
|
|
|
Fig. 6. Base reactions of (G+3) storey buildings for gravity loads |
Fig. 7. Base reactions of (G+3) storey buildings by response spectrum analysis along x and y directions |
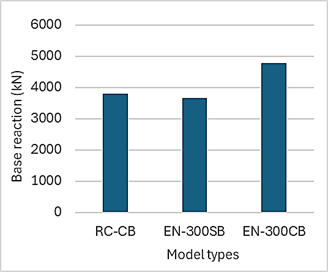
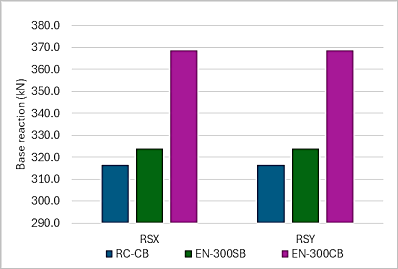
Base reactions of (G+3) building models shown in Fig. 6 and Fig. 7 for RC-CB, EN-300SB, and EN-300CB models reveal that the EN-300CB consistently exhibits higher values across the output cases. For the gravity loads, the base reaction of EN-300CB is approximately 25.94% higher than RC-CB and 30.62% higher than EN-300SB. From response spectrum analysis in x and y directions, the base reaction of EN-300CB is around 16.46% higher than RC-CB and 13.83% higher than EN-300SB.
|
|
|
|
Fig. 8. Storey stiffness of (G+3) storey buildings along x direction by response spectrum analysis |
Fig. 9. Storey stiffness of (G+3) Storey buildings along y direction by response spectrum analysis |
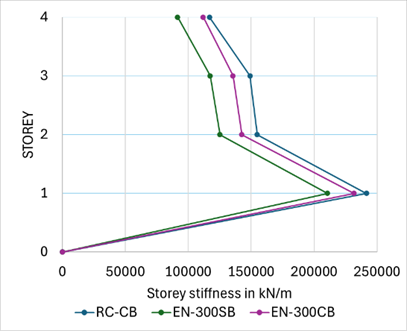
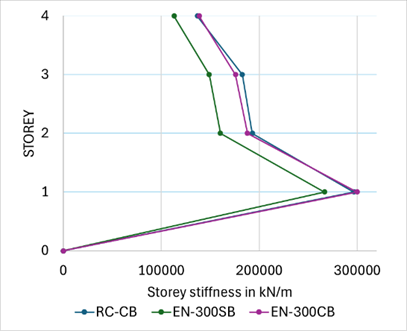
Story Stiffness values of (G+3) building models depicted in Fig. 8 and Fig. 9 highlight significant variations in RC-CB, EN-300SB, and EN-300CB buildings. It is evident from both the figures that RC-CB and EN-300CB buildings exhibit higher stiffness as compared to EN-300SB. Along x and y directions, EN-300CB shows a stiffness superiority of about 44% and 42% as compared to EN-300SB respectively. But RC-CB shows the highest storey stiffness of all three models considered in phase-1.
|
|
|
|
Fig. 10. Storey drifts of (G+3) Storey buildings along x-direction by response spectrum analysis |
Fig. 11. Storey drifts of (G+3) Storey buildings along y-direction by response spectrum analysis |
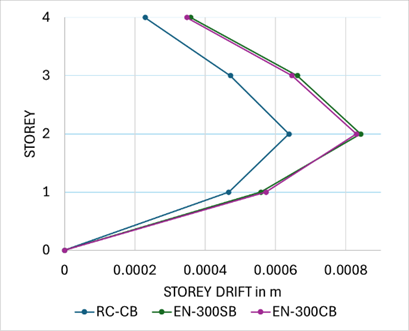
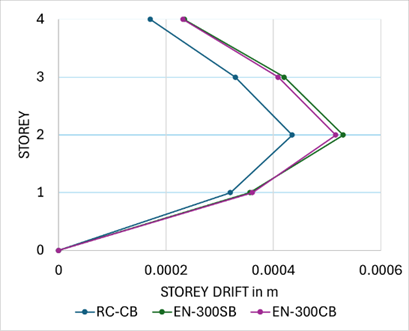
Storey drifts of (G+3) building models along x and y directions reveal notable differences in structural performance of RC-CB, EN-300SB, and EN-300CB buildings. As shown in Fig. 10 and Fig. 11, EN-300SB exhibits higher storey drifts compared to RC-CB, with percentage differences ranging from 8.74% to 3.12%, indicating a potential disadvantage in stability under lateral loads. Similarly, EN-300CB also demonstrates increased storey drifts compared to RC-CB, with differences ranging from 6.97% to 2.38%. Similar trends are observed along y-direction. It is important to note that the variation in storey drifts between EN-300SB and EN-300CB is very low, with EN-300CB offering marginally less drift values. RC-CB offers greater advantage in lowering storey drift values as compared to the other two building models in phase-1.
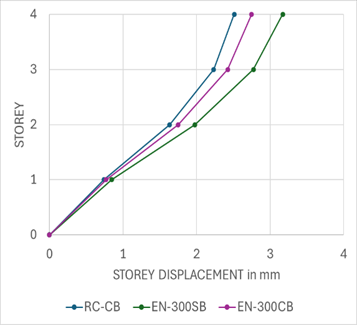
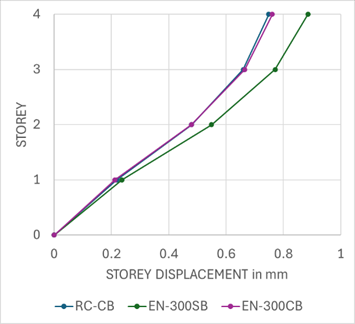
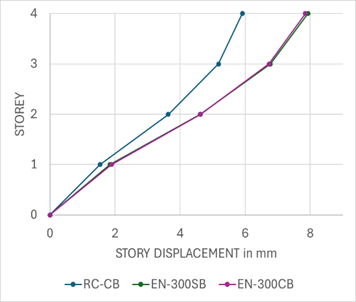
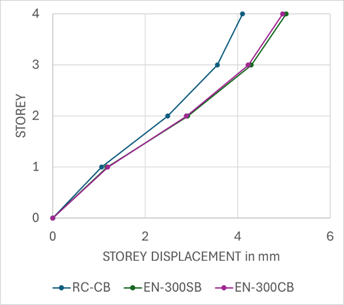
Storey displacements of (G+3) building models for wind along x and y directions are shown in Fig. 12 and Fig. 13 respectively. For wind along x direction, RC-CB and EN-300CB show significantly lower story displacements of 23% and 14% as compared to EN-300SB. For wind in y direction, similar trends are observed with RC-CB and EN-300CB demonstrating notable improvements over EN-300SB in controlling story displacements. As shown in Fig. 14 and 15, for response spectrum in x and y directions, RC-CB shows improved performance in reducing story displacements as compared to EN-300CB and EN-300SB. But storey displacement variations of EN-300CB and EN-300SB are very less, with EN-300CB offering marginally less displacement values.
From the analysis of (G+3) storey building models in phase-1, RC-CB and EN-300CB models show better performance than EN-300SB. Since EN-300SB shows lower story stiffness, higher story displacements and story drifts, steel section as a beam component in composite buildings has been discarded. Further, (G+25) storey composite buildings with composite column and RCC beam have been considered for dynamic analysis.
3.2 Phase-2
Phase-2 involves analysis of (G+25) storey building models, Model – 4, 5 and 6 to evaluate base reactions, storey stiffness, storey drifts and storey displacements for lateral forces in both x and y directions. The analysis is carried out based on the performance of building models from phase-1 by considering conventional RCC and two configurations of composite building models.
|
|
|
|
Fig. 16. Base reactions of (G+25) storey buildings for gravity load |
Fig. 17. Base reactions of (G+25) storey buildings by response spectrum method along x and y directions |
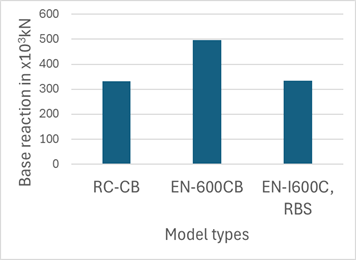
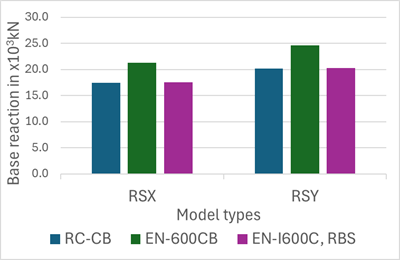
Base reactions shown in Fig. 16 and Fig. 17 for RC-CB, EN-600CB, and EN-I600C, RBS of (G+25) storey building models reveal that the EN-600CB consistently exhibits higher values across all output cases. Specifically, for the gravity load, the base reaction of EN-600CB is approximately 39.77% higher than RC-CB and 38.93% higher than EN-I600C, RBS. From response spectrum analysis in x direction, the base reaction of EN-600CB is around 20% higher than RC-CB. Similarly, from response spectrum analysis in y direction, EN-600CB's base reaction is about 19.89% higher than RC-CB. These increased values for the EN-600CB model are due to its higher self-weight.
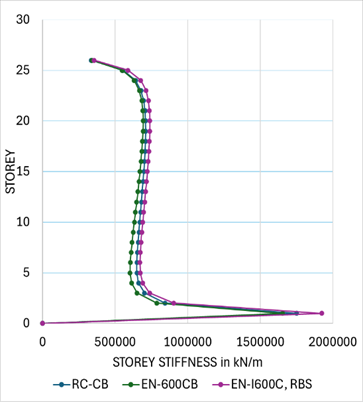
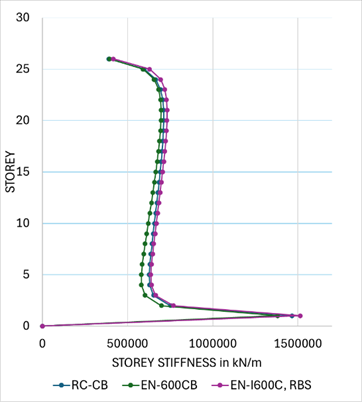
Story Stiffness values of (G+25) storey building models by response spectrum analysis shown in Fig. 18 and Fig. 19 highlight significant differences in RC-CB, EN-600CB, and EN-I600C, RBS buildings. It is evident from both figures that EN-I600C, RBS buildings consistently exhibit higher stiffness compared to RC-CB and EN-600CB. Along x and y directions, EN-I600C, RBS demonstrates a storey stiffness advantage of approximately 2.5% and 6.67% over EN-600CB along x and y directions respectively.
|
|
|
|
Fig. 18. Story stiffness of (G+25) storey building along x direction by response spectrum analysis |
Fig. 19. Story stiffness of (G+25) storey building along y direction by response spectrum analysis |
|
|
|
|
Fig. 20. Storey drifts of (G+25) storey building along x direction by response spectrum analysis |
Fig. 21. Storey drifts of (G+25) storey building along y direction by response spectrum analysis |
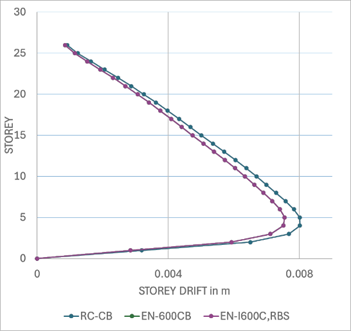
Storey drifts of (G+25) storey building models along x and y directions by response spectrum analysis reveal notable differences in structural performance of RC-CB, EN-600CB, and EN-I600C, RBS buildings. As shown in Fig. 20 and Fig. 21, EN-I600C, RBS exhibit lower storey drifts compared to RC-CB, with percentage differences ranging from 7.36%, indicating potential advantages in stability under lateral loads. Along y direction, EN-I600C, RBS generally outperforms RC-CB with 4.31%. EN-600CB offers least resistance to storey drifts among all the three building models considered in the study along both x and y directions.
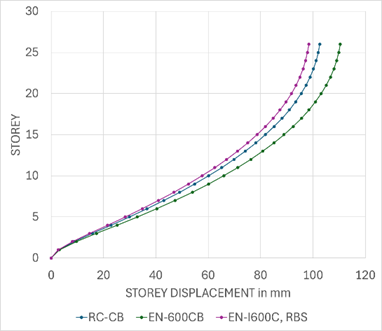
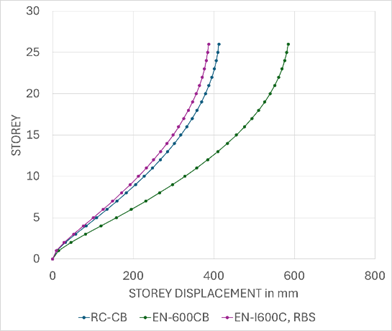
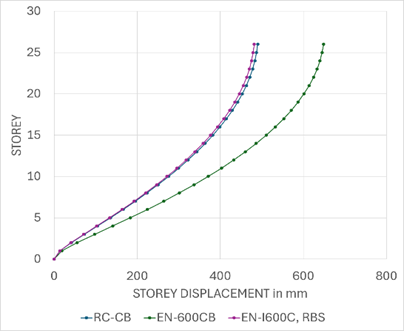
Storey displacements of (G+25) storey building models for wind along x and y directions are shown in Fig. 22 and Fig. 23 respectively. For wind along x direction, EN-I600C, RBS show significantly lower story displacements of 4.2% and 12.14% as compared to RC-CB and EN-600CB respectively. For wind along y direction, similar trends are observed with 2.17% and 9.05% lesser storey displacements for RC-CB and EN-I600C, RBS respectively demonstrating notable improvements over EN-600CB in controlling story displacements. As shown in Fig. 24 and Fig. 25, storey displacements of (G+25) storey building models by response spectrum analysis in x and y directions, EN-I600C, RBS shows improved performance in reducing story displacements by 6.3% and 50.8% as compared to RC-CB and EN-600CB respectively in x direction and 1.7% and 34.65% respectively in y direction.
|
|
|
|
Fig. 22. Storey displacements of (G+25) storey building for wind along x direction |
Fig. 23. Storey displacements of (G+25) storey building for wind along y direction |
|
|
|
|
Fig. 24. Storey displacements of (G+25) storey building along x direction by response spectrum analysis |
Fig. 25. Storey displacements of (G+25) storey building along y direction by response spectrum analysis |
From the analysis of (G+25) storey building models in phase-2, RC-CB and EN-I600C, RBS models show better performance than EN-600CB with higher story stiffness, lesser storey displacements and story drifts. EN-I600C, RBS outperformed other two models and hence the combination of composite column, RCC beam and RCC slab is observed to offer better resistance to lateral loads. Further, (G+25) storey composite buildings with vertical geometric irregularity have been considered with composite column and RCC beam and RCC slabs in phase-3 for dynamic analysis.
3.3 Phase-3
Phase-3 involves analysis of (G+25) storey vertical geometric irregular building models, Model – 7, 8, 9 and 10 to evaluate base reactions, storey stiffness, storey drifts and storey displacements for lateral forces in both x and y directions. The analysis is carried out based on the performance of building models from phase-2 by considering conventional RCC and three configurations of composite building models.
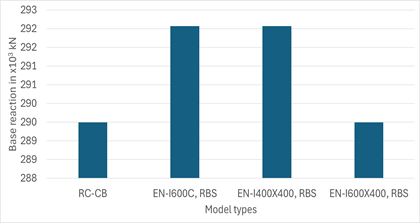
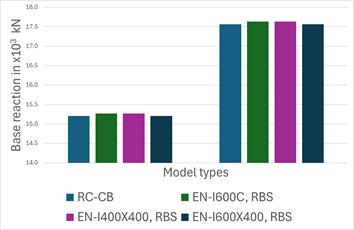
Base reactions of (G+25) storey vertical geometric irregular building models due to gravity loads and by response spectrum analysis are shown in Fig. 26 and Fig. 27. Fig. 26 reveals that EN-I600C, RBS and EN-I400X400, RBS exhibit considerably higher values as compared to RC-CB and EN-I600X400, RBS. The difference between EN-I600C, RBS and EN-I400X400, RBS is very negligible. From response spectrum analysis in x and y directions, variations in the base reactions of all models considered in the present phase are minimal.
|
|
|
|
Fig. 26. Base reactions of (G+25) storey vertical geometric irregular building for gravity load. |
Fig. 27. Base reactions of (G+25) Storey vertical geometric irregular building by response spectrum along x and y directions |
|
|
|
|
Fig. 28. Story stiffness of (G+25) Storey vertical geometric irregular building along x direction by response spectrum analysis |
Fig. 29. Story stiffness of (G+25) Storey vertical geometric irregular building along y direction by response spectrum analysis |
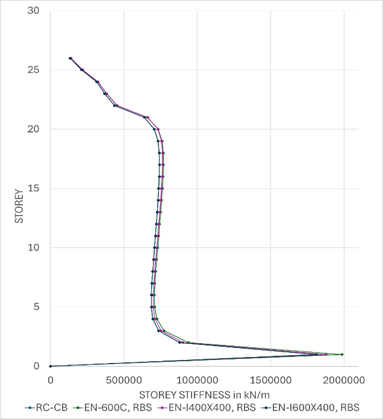
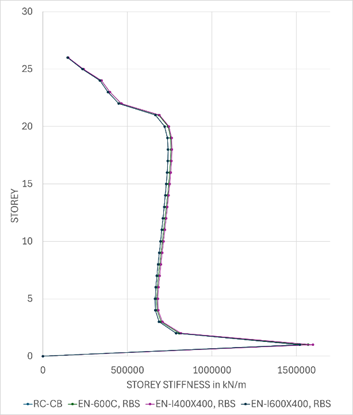
Story Stiffness of (G+25) building models, RC-CB, EN-I600C, RBS, EN-I400X400, RBS and EN-I600X400, RBS along x and y directions by response spectrum analysis are shown in Fig. 28 and Fig. 29 respectively. The variations indicate minimal differences. But EN-I600C, RBS exhibit higher storey stiffness along x direction, whereas EN-I400X400, RBS exhibit higher storey stiffness along y direction, both approximately around 3% as compared to storey stiffness of RC-CB.
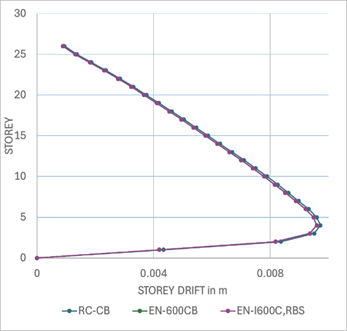
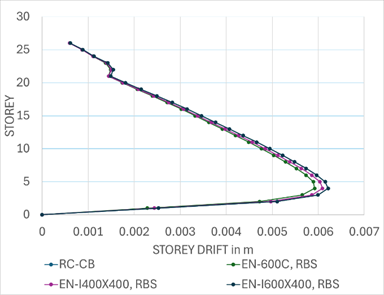
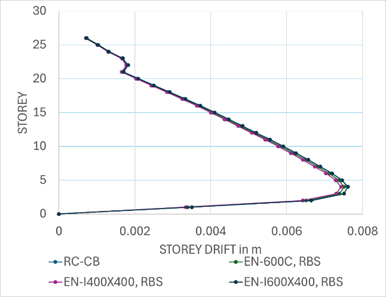
Storey drifts of (G+25) building models, RC-CB, EN-I600C, RBS, EN-I400X400, RBS and EN-I600X400, RBS along x and y directions by response spectrum analysis are shown in Fig. 30 and Fig. 31 respectively. In line with storey stiffness, the variations in storey drifts are minimal. But EN-I600C, RBS exhibit least storey stiffness along x direction, around 11.5% as compared to RC-CB, whereas EN-I400X400, RBS exhibit least storey stiffness along y direction.
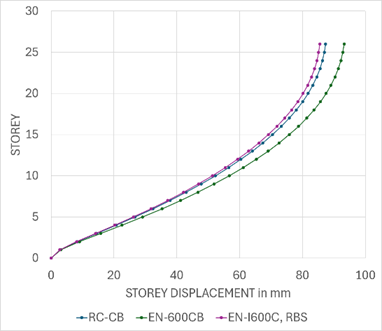
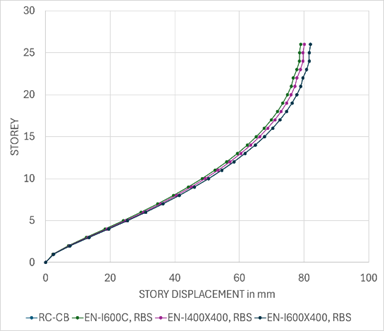
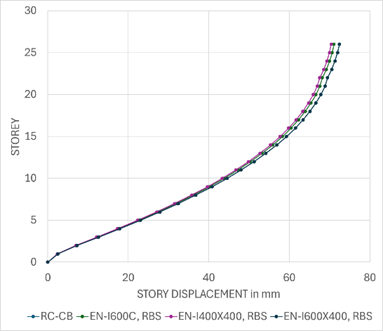
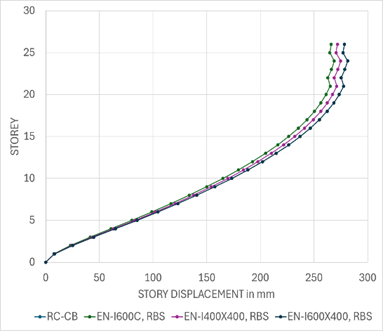
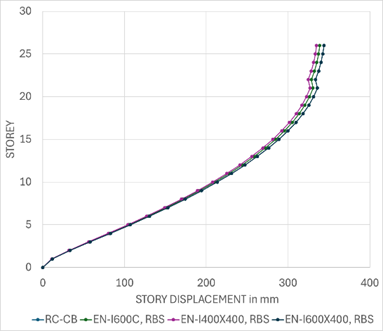
Storey displacements of (G+25) storey vertical geometric irregular building along x and y directions due to wind and by response spectrum analysis are shown in Fig. 32 to Fig. 35. EN-I600C, RBS along x direction and EN-I400X400C, RBS along y direction show the least values for wind and by response spectrum analysis as compared to all other building models considered in the present phase.
|
|
|
|
Fig. 30. Storey drifts of (G+25) Storey vertical geometric irregular building along x direction by resonse spectrum analysis |
Fig. 31. Storey drifts of (G+25) Storey vertical geometric irregular building along y direction by resonse spectrum analysis |
|
|
|
|
Fig. 32. Storey displacements of (G+25) storey vertical geometric irregular building for wind along x direction |
Fig. 33. Storey displacements of (G+25) storey vertical geometric irregular building for wind along y direction |
|
|
|
|
Fig. 34. Storey displacements of (G+25) storey vertical geometric irregular building along x direction by resonse spectrum analysis |
Fig. 35. Storey displacements of (G+25) storey vertical geometric irregular building along y direction by resonse spectrum analysis |
From the analysis of (G+25) storey building models with vertical geometric irregularity in phase-3, EN-I600C, RBS model offers better performance along x direction and EN-I400X400, RBS along y direction with higher story stiffness, lower storey displacements and story drifts as compared to other building models. Composite building models outperformed RC-CB building models and hence the cautious combination of composite elements is observed to offer better lateral resistance to wind and seismic loads by utilizing steel-concrete synergy that combines the strengths of concrete and steel, making them ideal for high-rise buildings by effectively sharing forces between the two materials. Thus, composite structures offer enhanced energy dissipation, better performance under lateral forces, and economical design.
4 Conclusions
In (G+25) regular building models subjected to dynamic lateral loadings, RC-CB and EN-I600C, RBS models showed better performance than EN-600CB with higher story stiffness, lower storey displacements and story drifts as compared to EN-600CB. EN-I600C, RBS performed better than other two models and hence the combination of composite column, RCC beam and RCC slab is observed to offer better resistance to lateral loads.
In (G+25) vertical irregular building models subjected to dynamic lateral loadings, EN-I600C, RBS model offers better performance along x direction and EN-I400X400, RBS along y direction with higher story stiffness, lower storey displacements and story drifts as compared to other building models. Hence the combination of composite column, RCC beam and RCC slab is observed to offer better resistance to lateral loads like that of phase-2. Therefore, the composite building with concrete encased I-section columns, RCC beams, and RCC slabs proves to be more effective than all other building models with various combinations considered in the study in offering better lateral resistance to wind and seismic loads.
In general, from the comparison between RCC and composite buildings considered in the study, the composite building with cautious selection of suitable concrete encased steel column, RCC beam and RCC slab performs significantly better than conventional RCC building in terms of resistance to lateral loads because of superiority attributed due to the inherent properties of composite materials and the structural integrity achieved.
The methodology of the present study can be extended to high-risk zones. Various combinations of slender composite members can be considered with high performance concrete, fibre reinforced polymer concrete or ultra-high strength steel to further enhance resistance to lateral forces. Life cycle assessment and sustainability approaches can be extended for composite systems.
Acknowledgements
The authors would like to thank the Department of Civil Engineering, Manipal Institute of Technology, Manipal Academy of Higher Education (MAHE), Manipal for the computing resources provided to carry out the study.
References
- Divya, R., & Murali, K. (2021). Comparative study on design of steel structures and RCC frame structures based on column span. Materials Today: Proceedings, 46, 8848–8853. https://doi.org/10.1016/j.matpr.2021.04.391
- Sandeep, G. S., Jagadisha, H. M., & Sindhu, V. N. (2024). Influence of Vertical Geometric Irregularities of Reinforced Concrete Buildings on the Time Period for Different Bay Widths and Building Heights. Civil Engineering and Architecture, 12(2), 840–849. https://doi.org/10.13189/cea.2024.120213
- Farajpourbonab, E., Kute, S. Y., & Inamdar, V. M. (2018). Steel-reinforced concrete-filled steel tubular columns under axial and lateral cyclic loading. International Journal of Advanced Structural Engineering, 10(1), 61–72. https://doi.org/10.1007/s40091-018-0186-0
- Tomer, S., & Bhandari, M. (2023). Evaluation of Seismic Response of Irregular Buildings: A Review. IOP Conference Series: Earth and Environmental Science, 1110(1). https://doi.org/10.1088/1755-1315/1110/1/012012
- Zaveri, B. H., Panchotiya, B. K., Patel, S. U., & Bilimoria, P. A. (2016). Parametric Study of RCC, Steel and Composite Structures Under Seismic Loading. International Journal of Civil Engineering and Technology (IJCIET), 7(4), 127–147.
- Chaudhary, M. K., & Khan, A. (2021). Analysis of a High Rise Building Frame Under Wind Pressure Considering Steel RCC Composite Structure: A Review. International Journal of Scientific Research in Civil Engineering, 5(6), 53–61.
- Wang Y., Liao T., Zheng Z., Lai Z., Zuo J., Dong C., Guo J. (2023). Seismic behavior of an innovative assembled composite structural wall. Journal of Constructional Steel Research, 211. https://doi.org/10.1016/j.jcsr.2023.108152
- Xue Y., Yang Y., Yu Y. (2019). Cyclic behavior of partially precast steel reinforced concrete short columns: Experiment and theoretical analysis. Engineering Structures, 199. https://doi.org/10.1016/j.engstruct.2019.109658
- Singh, H., Tiwary, A. K., Thakur, S., & Thakur, G. (2024). Performance evaluation of high-rise reinforced concrete buildings under dynamic loading considering different structural systems. Materials Today: Proceedings, 103, 176–182. https://doi.org/10.1016/j.matpr.2023.08.251
- Laddha, V. R., Siddh, S. P., & Hiwas, P. D. (2021). Analytical Investigation of Composite Structure in Comparison of RCC Structure. IOP Conference Series: Materials Science and Engineering, 1197, 012069. https://doi.org/10.1088/1757-899X/1197/1/012069
- Phatale, S. S., & Parekar, S. R. (2019). Seismic Analysis of RCC, Steel and Steel Concrete Composite Frame. International Journal for Research in Applied Science & Engineering Technology (IJRASET), 7(VII), 249–253. http://doi.org/10.22214/ijraset.2019.7037
- Zhang, Q. Q., & Zhang, L. N. (2024). A comparative analysis of RCC and composite buildings using the new plastic deformation (PD) method. Scientific Reports, 14, 5666. https://doi.org/10.1038/s41598-024-55892-y
- Abhijeet M. Navpute and A. N. Humnabad (2021). Comparative Study on Dynamic Analysis of RCC, Steel & Steel-Concrete Composite (G+20 Story) Building. International Journal of All Research Education and Scientific Method Volume 9, Issue 7.
- IS 875 (Part 1): 1987, Code of Practice for Design Loads (Other than Earthquake) for Buildings and Structures, Part-1 Dead Loads, Second Revision, Bureau of Indian Standards (BIS), New Delhi, India
- IS 875 (Part 2): 1987, Code of Practice for Design Loads (Other than Earthquake) for Buildings and Structures, Part-2 Imposed Loads, Second Revision, Bureau of Indian Standards (BIS), New Delhi, India
- IS 875 (Part 3): 2015, Code of Practice for Design Loads (Other than Earthquake) for Buildings and Structures, Part-3 Wind Loads, Third Revision, Bureau of Indian Standards (BIS), New Delhi, India
- IS 1893:2016 (Part 1). Code of Practice for Criteria for Earthquake Resistant Design of Structures, Part-1 General Provisions and Buildings, Sixth Revision, Bureau of Indian Standards (BIS), New Delhi, India.
- IS 11384:2022 (Part 1). Code of Practice for Composite Construction in Structural Steel and Concrete, First Revision, Bureau of Indian Standards (BIS), New Delhi, India.
Conflict of Interest Statement
All authors declare that there are no conflicts of interest.
Author Contributions
Data Availability Statement
There is no dataset associated with the study or data is not shared.
Supplementary Materials
There are no supplementary materials to include.