Original Scientific Paper, Volume 23, Number 2, Year 2025, No 1272, pp 280-290
Received: Dec 04, 2024 Accepted: Mar 24, 2025 Published: Jun 16, 2025
DOI: 10.5937/jaes0-55194
EVALUATION OF THE INFLUENCE OF STRUCTURAL PARAMETERS ON THE CHARACTERISTICS OF ANTI-ROLL BARS IN TRUCKS BY USING FINITE ELEMENT METHOD
Abstract
The anti-roll bar is a critical component of the automotive suspension system, designed to improve vehicle stability during cornering or when uneven road surfaces induce load transfer between the wheels at an axle. This paper focuses on evaluating the characteristic changes of the anti-roll bar when modifying structural parameters and the positioning of bushings by using the Finite Element Method (FEM) by using HyperMesh software. Firstly, the anti-roll bar's dimensions were measured based on a truck anti-roll bar model, then a 3D model was created in Catia, followed by simulation and analysis in HyperMesh software. The simulation results were visualized using HyperView software. To examine the influence of structural parameters on the anti-roll bar's characteristics, this study concentrates on varying diameter sizes and different distances between rubber bushings. The results indicated significant changes in the relative displacement between the two poles of the bar and its stress distribution when the design parameters were altered. From these results, this study also evaluated the roll stiffness of the bar for trucks within a range of 10,000-50,000 Nm/rad. This research serves as a foundation for optimizing anti-roll bar designs, aiming for shape optimization and weight reduction while maintaining stiffness and durability, thereby enhancing vehicle safety under various operating conditions.
Highlights
- Co-simulation through Catia, HyperMesh, and HyperView for Finite Element Method problem to evaluate the influence of anti-roll bar diameter and bushing placement on structural and dynamic performance.
- Optimal design of anti-roll bar, with diameters ranging from 36–44 mm and bushing distances between 350–400 mm, ensures mechanical safety and material efficiency.
- Torsional stiffness range of 25,000–50,000 Nm/rad has its effectiveness to balance vehicle roll stability and fatigue durability.
- The 50CrV4 alloy steel, with its high tensile and yield strength, provides a robust foundation for lightweight and performance-optimized anti-roll bar designs.
Keywords
Content
1 Introduction
The anti-roll bar, also known as a sway bar or anti-roll bar, is an indispensable component of the suspension system in various vehicles, including passenger cars, trucks, and buses [1]. Its primary function is to reduce the roll angle of the vehicle body during cornering or turning, thereby enhancing handling stability and maintaining consistent tire-road contact. This is particularly crucial at high speeds or when uneven load distribution occurs across the wheels. By mitigating excessive lateral weight transfer, the anti-roll bar decreases the risk of rollover, ensuring dynamic stability for the driver, passengers, and cargo.
The operating principle of the anti-roll bar is based on its ability to resist relative vertical displacement between the two wheels on the same axle, thereby reducing the vehicle's roll angle during lateral maneuvers. When the vehicle turns, one side of the body tends to lift while the opposite side is pressed down due to centrifugal forces. The two ends of the anti-roll bar are pushed in opposite vertical directions (up and down), causing the middle section to twist. This torsional deformation transfers force from one side to the other, with the bar’s torsional moment creating a counteracting force at both poles that returns the vehicle body to a balanced position, thus reducing body roll and enhancing road grip and stability [2]. The anti-roll bar is not only effective during cornering but also beneficial when the vehicle travels straight over uneven surfaces. In such cases, if one of the wheels passes over a bump or a pothole, it moves up or down while the opposite wheel remains stationary. The anti-roll bar helps minimize the differential movement between the two sides of an axle by transferring force between them, preventing excessive lateral instability of the vehicle body and providing a smoother safety experience. This is particularly important for trucks and passenger buses, as it helps maintain vehicle stability and safety even on rough terrains [3].
Regarding installation, the anti-roll bar is attached to the chassis through four connection points. Two of these are rubber bushings that connect the bar to the vehicle frame, allowing free rotation during operation to reduce vibration and friction between the bar and the chassis. The other two connection points are located at the bar's ends, where it links to the axle or control arms of the independent suspension system via joint connections or bolts. This design enables the anti-roll bar to work efficiently with other suspension components to harmonize wheel movement and ensure flexibility due to diverse driving conditions.
In the research conducted by M.M. Topaç, H.E. Enginar, and N.S. Kuralay, the authors focused on reducing stress concentration at the bend of the lever arm and shortening the overall bar length [7]. To further optimize the design, K.K. Sharma, A. Rashid, and S. Mandale [8] considered variations in lever arm length as well as the distance between bushings. Other studies such as [9], [10], [12], [13], and [15] paid attention to adjusting geometric factors with the bushing distance and angle between anti-roll bar's lever arms. Study [19] developed a suspension system for an FSAE combustion vehicle, incorporating a bar-type anti-roll bar (ARB) to adjust understeer and oversteer characteristics. A kinematic study analyzed camber angle, steer angle, track change, and roll angle with and without ARB using IPG software, while structural simulations in ANSYS evaluated component stresses, particularly torsional effects on the ARB. Additionally, study [4] analyzed the effects of spring and anti-roll bar stiffness on vehicle dynamics and developed a multibody dynamics model to optimize these parameters using the NSGA-II algorithm. The results showed that at 0.5Hz, the optimized stiffness reduced the frequency response gain while maintaining an acceptable delay time, improving low-frequency dynamic performance.
Additionally, several studies have examined the influence of material properties and bushings on the performance of the anti-roll bar. Study [15] focused on the effects of various materials on the working capacity of the anti-roll bar. Meanwhile, research [21] investigated the effects of replacing conventional steel with composite glass fiber epoxy for an automotive anti-roll bar, optimizing key design parameters using response surface methodology and analyzing performance through finite element simulations in ANSYS ACP. Notably, study [16] investigated the impact of polyurethane bushing thickness on stress distribution in an SAE 9262 anti-roll bar using FEA in Ansys Workbench. Results showed that the highest stress occurred at the inner surface of the corner bend, where failure is most likely. Increasing bushing thickness reduced stress, with solid bars showing up to an 11% reduction and hollow bars 6%.
Regarding the fatigue life of the anti-roll bar, study [14] experimented with varying the bend radius, concluding that a 57mm bend radius with 50CrV4 alloy reduced stress by 23.69% compared to a standard bar. Moreover, study [17] presented the design process of an anti-roll bar for a Formula SAE vehicle suspension, including theoretical analysis, simulation, and testing to optimize stability characteristics and vehicle performance. Additionally, study [20] proposed two simulation methods for the bushing constraint: RBE2, a rigid element enforcing full displacement continuity, and RBE3, a flexible element distributing forces without rigid constraints. Results showed that RBE3 reduced stress by 4% and better matched experimental stiffness. Also, study [22] optimized the anti-roll bar of an urban electric bus by analyzing different diameters and materials using finite element simulations, and the results showed that a 36mm AISI 1065 steel bar provided the best balance of stiffness and weight.
Considering the bar structure, study [18] compared solid and hollow bars, finding that hollow bars experienced greater shear stress than solid bars under the same boundary conditions. Study [11] explored the replacement of a forged solid stabilizer rod with a high-strength tubular stabilizer bar to reduce weight and improve fuel efficiency, validating torsional stress estimations through FEA simulations and experimental evaluation.
Regarding roll stability enhancement, these studies developed an active anti-roll bar (AARB) system using an H∞ control approach for heavy vehicles. The system actively adjusted roll stiffness based on driving conditions, and results showed improved stability and reduced body roll compared to passive systems.
The primary objective of anti-roll bar design is to achieve optimal roll stiffness, enhancing the suspension system's stability and performance while preventing the bar from being overloaded and exceeding its mechanical limits. To accomplish this, the bar must provide sufficient stiffness to minimize vehicle body roll while retaining enough flexibility to avoid excessive interference with other suspension components. In this research, the anti-roll bar is examined with a new geometric structure, focusing on adjusting critical technical parameters such as diameter, the length of bend sections, and bushing installation locations on the bar. Section 2 presents the mathematical model of the anti-roll bar which is well-known in commercial vehicles as well as the proposed model with its different characteristics. The objective of these modifications is to optimize load-bearing capacity and meet practical usage requirements for current types of vehicles. The Finite Element Method (FEM) with detailed simulations performed in HyperMesh software, a specialized tool for structural analysis and optimization in mechanical engineering, as described in Section 3. Results from the simulations include displacement and stress distribution across the anti-roll bar, which helps assess its deformation capacity and identify areas prone to high stress concentrations. Additionally, these values are used to calculate roll stiffness, enabling the identification of the bar’s most effective working range under specific operational conditions as illustrated in Section 4. Finally, Section 5 provides the conclusions and further research.
2 Materials and methods
2.1 The mathematical model of anti-roll bar
For a standard-shaped anti-roll bar shown in Figure 1 [6], the roll stiffness of the anti-roll bar and the deflection at its two poles are influenced by factors such as applied load, the elastic modulus of the manufacturing material, lever arm distances, and the outer diameter of the anti-roll bar.
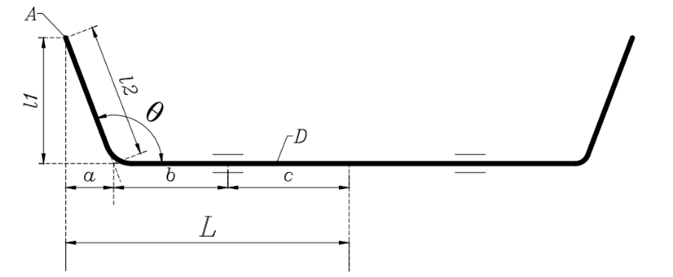
Fig. 1. The standard U-shaped anti-roll bar [1]
Assuming that a load P is applied at point A, inward to or outward from the plane of the page, the roll stiffness of the bar can be calculated as follows [23], [24], [25]:
\[K_R=(PL^2)/(2f_A ) (Nm/rad) (1)\]
where f_A- deflection of point A can be calculated as:
$f_A=\frac{P}{3.E.I}[l_1^3-a^3+L/2(a+b)^2+4l_2^2(a+b)] \approx f_A=F.L33.E.I+F.r2G.I$ (2)
with:
$G=\frac{E}{2.\left(1+\mu\right)}$- the shear modulus of elasticity.
$\mu $ - Poisson’s ratio.
The material for anti-roll bar: \mu = 0,3.
The material for rubber bushings: \mu =0,45.
$L\ =\ a\ +\ b\ +\ c $ - half length of the anti-roll bar.
$I=\frac{\pi D^4}{64}$ - Moment of inertia.
D: Outer diameter; $E\ =\ 210000MPa$ - Modulus of elasticity.
Assuming that the bend angle of the bar (in Figure 1) is 90^\circ then \ a=0\Rightarrow l_1=l_2. By transferring the force F from point A to the centroid of the anti-roll bar, we obtain three components for the bar as follows: the force F, the torsional moment T=Fl_1, and the bending moment M=FL. Figure 2a) illustrates the anti-roll bar which is installed on Hino 500 series trucks, where point A is the force acting to the bar, and point O is the origin corresponding to the center of the cross-section of half of the anti-roll bar. The lengths a, b, c, d, e, f, l (in Figure 2b) represents different sections of the bar.
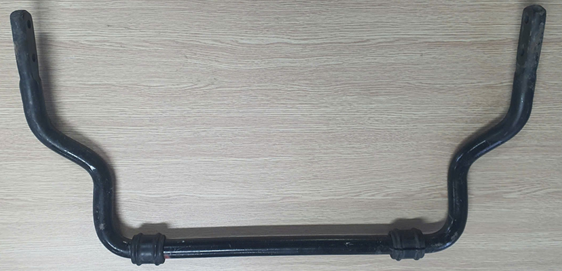
Fig. 2a. Shape of the anti-roll bar in trucks: a) actual manufactured bar, b) geometric diagram of the bar
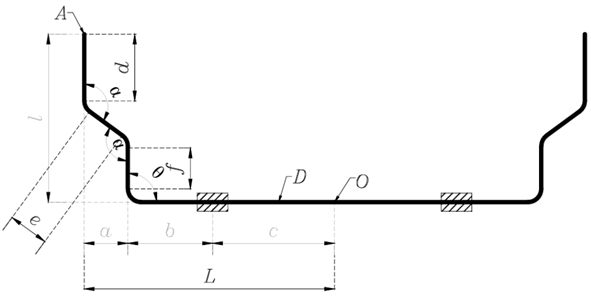
Fig. 2b. Shape of the anti-roll bar in trucks: a) actual manufactured bar, b) geometric diagram of the bar
The angles \alpha,\ \theta of the anti-roll bar in model Figure 2 can be calculated as equations (3), (4), (5).
$cos{\alpha}=\frac{L^2+d^2-e^2}{2Ld}$) (3)
$cos{\theta}=\frac{d^2+e^2-f^2}{2de}$) (4)
$\frac{L}{sin{(}\alpha)}=\frac{d}{sin{\left(\theta\right)}}$) (5)
The deflection of point A can be calculated as [26]:
$f_A=FL33EI+F2απr2GJ$) (6)
When the value of \alpha changes, the value of f_A also changes. In this case, Equation (6) reverts to Equation (2) for the basic U-shaped bar.
2.2 Design and analysis of the anti-roll bar
This section details the stages from creating a 3D model to analyzing it by using the FEM on HyperMesh software, with results displayed on HyperView software, as shown in Figure 3. The analysis process consists of three main stages: modeling and meshing by Catia; assigning boundary conditions and selecting the analysis type by HyperMesh; and finally, evaluating the analysis results by HyperView.
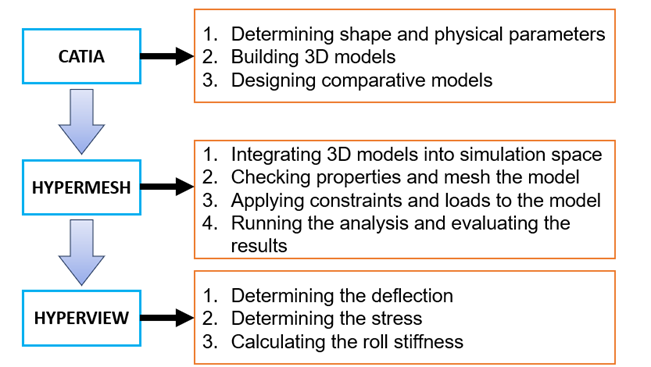
Fig. 3. The analysis process of the anti-roll bar
2.2.1 Define analysis objectives
The analysis aims to determine the displacement and stress distribution within the anti-roll bar subjected to diverse loading conditions. The calculated values will be utilized to compute the bar's roll stiffness through Equation (1). Moreover, the analysis seeks to evaluate the material's yield strength, enabling the determination of the ultimate load-carrying capacity of the anti-roll bar based on the maximum principal stresses and strains at critical sections.
|
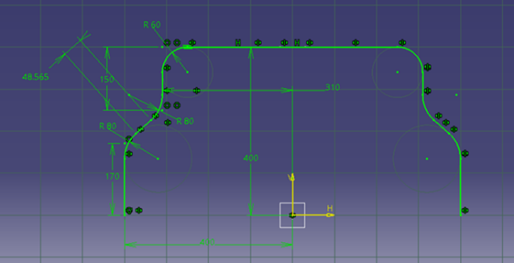
Fig. 4. 2D geometry of the anti-roll bar in Catia software |
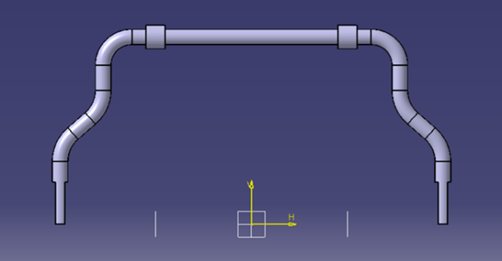
Fig. 5. 3D model of the anti-roll bar once the parameters and geometry are defined |
|
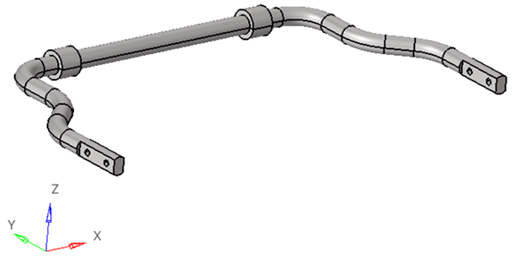
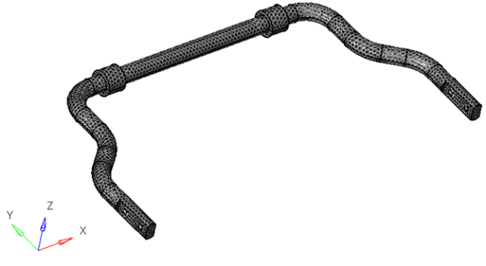
Fig. 6. Anti-roll bar model in HyperMesh software |
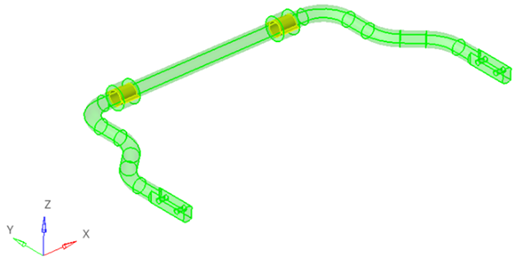
Fig. 7. Geometric relationship check between the anti-roll bar and bushing |
|
Fig. 8. Mesh topology of the anti-roll bar |
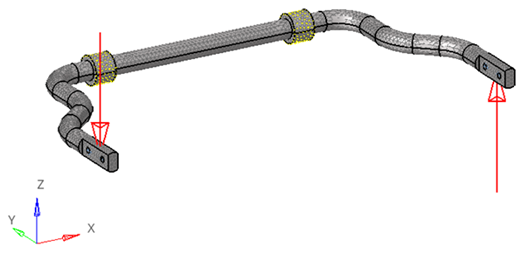
Fig. 9. Boundary conditions and loads applied to the anti-roll bar |
2.2.2 Export the 3D model and apply boundary conditions
The 3D model of the anti-roll bar was constructed using Catia software (Figure 5), then transferred to HyperMesh software (Figure 6). During this process, geometric errors such as incomplete surface contact within the model were checked and adjusted as shown in Figure 7. Subsequently, a finite element mesh was generated to create a more detailed numerical model of the anti-roll bar (Figure 8). Meshing, which significantly influences the accuracy of calculation results, achieves higher precision with finer resolutions but at the cost of increased computation time.
The computational model incorporated two materials: alloy steel (50CrV4) for the anti-roll bar and rubber for the bushings, with material properties determined in accordance with ASTM manufacturing standards [14], [21]. In the analysis process, the distance between the two bushings was varied across 11 cases from 200mm to 460mm with a step size of 26mm. The diameter of the anti-roll bar was also varied across 11 cases from 20mm to 60mm with a step size of 4mm to evaluate the influence of the anti-roll bar diameter on deflection, stress, and roll stiffness.
2.2.3 Apply constraint and load
The anti-roll bar is connected to the vehicle frame through two rubber bushings and suspension components. At these connection points, the bar can rotate freely within the bushings but is restricted from horizontal and vertical movement (Figure 9). During dynamic vehicle maneuvers, such as cornering or lateral body roll induced by operating conditions, one end of the anti-roll bar undergoes downward displacement, while the other end experiences upward displacement, generating a counteracting torsional resistance to mitigate roll angle. The loads applied to the anti-roll bar result in relative displacement between the two poles of the bar and simultaneously induce bending and torsional forces.
After applying boundary conditions and loads, the analysis problem is solved using the software's algorithms, resulting in displacements, stresses, and other important parameters to evaluate the performance of the anti-roll bar under various loading conditions.
3 Results and discussion
3.1 Evaluation of anti-roll bar deflection
The simulation results obtained using the FEM for the anti-roll bar subjected to load F=12000\ N are presented in Figure 10 and Table 1, these results clearly demonstrate the trend of displacement variation at both poles of the bar. Specifically, the displacement value decreases as the bar diameter increases and the distance between the two bushings increases. The maximum displacement is \mathrm{\Delta}=504,64\ mm when the bar has a diameter of D\ =20\ mm and the distance between the two bushings is 2c=200\ mm. Conversely, the minimum displacement is \mathrm{\Delta}=6,636\ mm when the diameter of the bar is D=60\ mmand the distance between the two bushings is 2c=460\ mm.
|
D=20\ mm,\mathrm{\ 2}c200\ mm |
D=60\ mm,\mathrm{\ 2c}=460\ mm |
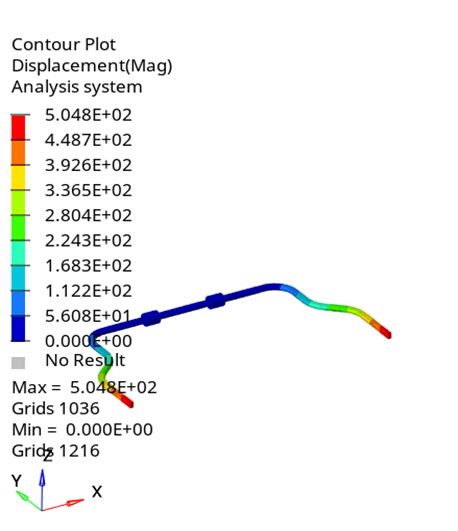
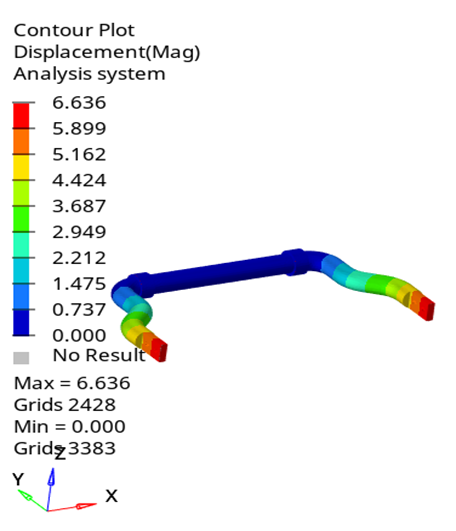
Fig. 10. Deflection contributes on the anti-roll bar
Table 1. Displacement value of anti-roll bar in analysis cases
|
|
Diameters of the bar (mm) |
|||||||||||
|
20 |
24 |
28 |
32 |
36 |
40 |
44 |
48 |
52 |
56 |
60 |
||
|
Distances of bushings (mm) |
200 |
504.641 |
258.182 |
144.7 |
88.438 |
56.488 |
37.9591 |
26.3994 |
19.29 |
14.248 |
10.813 |
8.422 |
|
226 |
487.311 |
250.958 |
141.304 |
86.2913 |
55.201 |
37.0432 |
25.7007 |
18.6902 |
13.7831 |
10.45 |
8.104 |
|
|
252 |
479.079 |
247.412 |
137.884 |
84.6534 |
53.8632 |
36.2273 |
25.1492 |
18.1964 |
13.3926 |
10.142 |
7.844 |
|
|
278 |
466.315 |
240.862 |
135.786 |
82.5139 |
52.8758 |
35.4072 |
24.624 |
17.7797 |
13.0799 |
9.891 |
7.626 |
|
|
304 |
454.485 |
234.937 |
132.071 |
81.1833 |
51.9714 |
34.7488 |
24.124 |
17.39 |
12.7867 |
9.661 |
7.444 |
|
|
330 |
441.527 |
230.474 |
129.4 |
79.5081 |
50.808 |
34.741 |
23.6397 |
17.0662 |
12.5194 |
9.462 |
7.276 |
|
|
356 |
431.448 |
224.498 |
126.447 |
77.9466 |
49.9355 |
33.3549 |
23.197 |
16.7323 |
12.309 |
9.271 |
7.127 |
|
|
382 |
415.849 |
220.599 |
124.599 |
76.5342 |
48.8319 |
32.6957 |
22.763 |
16.4329 |
12.085 |
9.096 |
6.995 |
|
|
408 |
403.811 |
213.5 |
121.993 |
74.7375 |
47.9765 |
32.0877 |
22.3982 |
16.1073 |
11.8578 |
8.935 |
6.866 |
|
|
434 |
398.262 |
209.121 |
119.495 |
73.297 |
47.0853 |
31.5012 |
21.9864 |
15.8535 |
11.677 |
8.789 |
6.749 |
|
|
460 |
389.325 |
204.726 |
116.588 |
71.7895 |
46.2628 |
30.9981 |
21.6286 |
15.6081 |
11.488 |
8.652 |
6.636 |
|
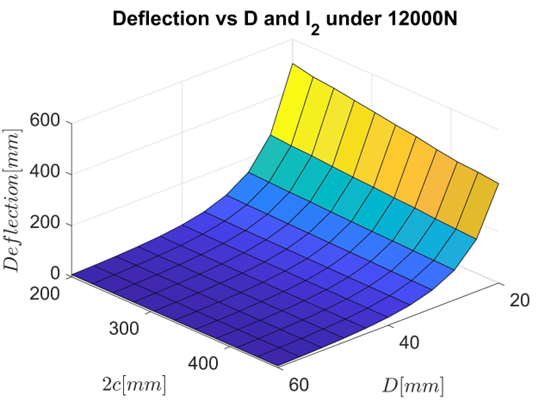
Fig. 11. Deflection chart of anti-roll bar
The anti-roll bar requires sufficient stiffness to reduce vehicle roll, but also needs adequate flexibility to absorb forces without damage. For medium-sized trucks, the maximum displacement of both ends of the bar is typically between 5 mm and 50 mm [2], [3]. Displacements exceeding 50 mm may indicate that the bar is too soft, resulting in reduced stabilization effectiveness, while displacements below 5 mm may suggest that the bar is too stiff, affecting driving comfort. With a high load of F=12000\ N, displacements between 10 mm and 40 mm ensure a balance between stability and flexibility.
3.2 Evaluation of anti-roll bar stress
|
|
D=60\ mm,2c=460\ mm |
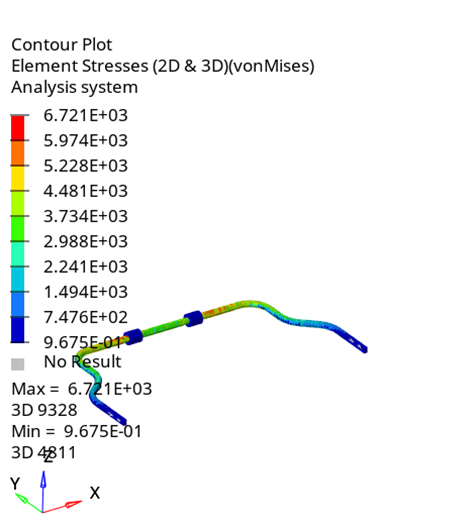
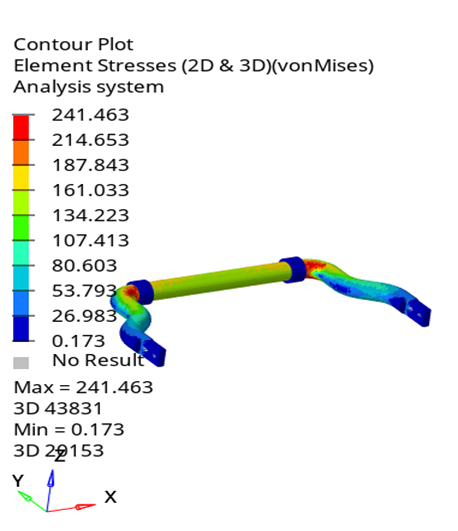
Fig. 12. Stress contributes on the anti-roll bar
Table 2. Stress value of anti-roll in analysis cases
|
|
Diameters of the bar (mm) |
|||||||||||
|
20 |
24 |
28 |
32 |
36 |
40 |
44 |
48 |
52 |
56 |
60 |
||
|
Distances of bushings (mm) |
200 |
6720.949 |
3665.54 |
2339 |
1622.98 |
1142.02 |
844.061 |
637.763 |
474.877 |
377.607 |
307.837 |
245.379 |
|
226 |
6386.7 |
3547.642 |
2363.2 |
1648.51 |
1102.8 |
792.939 |
605.325 |
469.391 |
367.604 |
297.132 |
244.765 |
|
|
252 |
6148.33 |
3482.98 |
2276.64 |
1548.81 |
1053.04 |
821.639 |
596.646 |
471.091 |
364.754 |
300.223 |
251.395 |
|
|
278 |
5911.7 |
3461.74 |
2234.52 |
1536.72 |
1020.24 |
778.46 |
578.204 |
462.894 |
353.423 |
304.359 |
246.642 |
|
|
304 |
5753.92 |
3467.89 |
2152.83 |
1474.94 |
1061.13 |
778.8 |
578.653 |
446.625 |
359.27 |
300.496 |
243.477 |
|
|
330 |
6074.44 |
3312.83 |
2122.46 |
1458.44 |
1043.69 |
766.167 |
590.488 |
461.431 |
360.3 |
308.066 |
249.333 |
|
|
356 |
5702.48 |
3193.55 |
2042.47 |
1432.76 |
1031.22 |
766.447 |
576.205 |
438.934 |
367.164 |
298.081 |
248.909 |
|
|
382 |
5838.03 |
3158.86 |
2103.3 |
1409.47 |
1016.43 |
749.936 |
581.313 |
458.86 |
361.562 |
298.938 |
246.713 |
|
|
408 |
5699.36 |
3180.396 |
2062 |
1455.71 |
1039.36 |
751.988 |
577.667 |
468.098 |
369.576 |
294.507 |
245.704 |
|
|
434 |
5427.89 |
3168.04 |
2114.87 |
1499.077 |
1040.73 |
742.253 |
593.761 |
460.752 |
359.904 |
302.381 |
243.01 |
|
|
460 |
5770.56 |
3399.35 |
2049.28 |
1399.44 |
1051.53 |
762.909 |
572.155 |
457.805 |
358.405 |
302.377 |
241.463 |
|
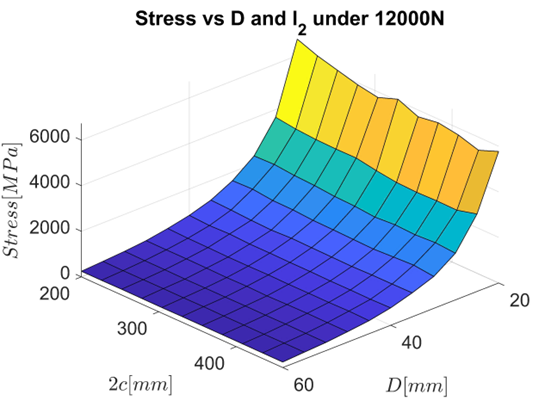
Fig. 13. Stress chart of anti-roll bar
As shown in Figures 12 and 13, as well as Table 2, the stress levels decrease with increasing bar diameter and bushing spacing. The maximum stress is \ \sigma=6720,95\ MPa when the diameter of the bar is D=20\ mm and the distance between the two bushings is 2c=200\ mm. On the contrary, the minimum stress is \ \sigma=241.46\ MPa, when the bar has a diameter of D=60\ mm and the distance between the two bushings is 2c=460\ mm. This observation aligns with the fundamental principles of materials science, indicating that increasing the bar diameter and bushing spacing is an effective solution to reduce stress concentrations in the bar.
In reality, the loads applied to both poles of the anti-roll bar typically fluctuate between 1000N and 6000N, depending on the vehicle categories, ranging from passenger cars to heavy trucks [2], [3]. In this study, the analysis was conducted with a load of 12000N, resulting in higher values compared to real-world conditions. However, this allows for an evaluation of the lifespan and performance of anti-roll bars under extreme conditions. Based on the analysis results and allowable stress values according to material property standards, a safe stress range of 800-1100MPa can be determined. A lower stress value would not fully utilize the bar's capacity and increase production costs. Therefore, a bar diameter of 36mm to 44mm with a bushing spacing of 350mm to 400mm is suitable for the given loading conditions.
3.3 Evaluation of anti-roll bar roll stiffness
The roll stiffness of the anti-roll bar is an important factor in improving the stability of the truck, calculated according to formula (1) and shown in Table 3.
Table 3. Roll stiffness value of anti-roll in analysis cases
|
|
Diameters of the bar (mm) |
|||||||||||
|
20 |
24 |
28 |
32 |
36 |
40 |
44 |
48 |
52 |
56 |
60 |
||
|
Distances of bushings (mm) |
200 |
1902.34 |
3718.31 |
6634.42 |
10855.06 |
16994.76 |
25290.38 |
36364.46 |
49766.72 |
67377.88 |
88782.02 |
113987.2 |
|
226 |
1969.99 |
3825.34 |
6793.86 |
11125.11 |
17390.99 |
25915.69 |
37353.07 |
51363.82 |
69650.51 |
91866.03 |
118460 |
|
|
252 |
2003.84 |
3880.17 |
6962.37 |
11340.36 |
17822.93 |
26499.35 |
38172.19 |
52757.69 |
71681.38 |
94655.89 |
122386.5 |
|
|
278 |
2058.69 |
3985.68 |
7069.95 |
11634.4 |
18155.75 |
27113.13 |
38986.35 |
53994.16 |
73395.06 |
97057.93 |
125885.1 |
|
|
304 |
2112.28 |
4086.20 |
7268.82 |
11825.09 |
18471.7 |
27626.85 |
39794.4 |
55204.14 |
75078.01 |
99368.6 |
128962.9 |
|
|
330 |
2174.27 |
4165.33 |
7418.86 |
12074.24 |
18894.66 |
27633.06 |
40609.65 |
56251.54 |
76680.99 |
101458.5 |
131940.6 |
|
|
356 |
2225.07 |
4276.21 |
7592.11 |
12316.12 |
19224.8 |
28781.38 |
41384.66 |
57374.06 |
77991.71 |
103548.7 |
134699 |
|
|
382 |
2308.53 |
4351.79 |
7704.72 |
12543.41 |
19659.28 |
29361.66 |
42173.7 |
58419.39 |
79437.32 |
105540.9 |
137240.9 |
|
|
408 |
2377.35 |
4496.49 |
7869.30 |
12844.96 |
20009.8 |
29918.01 |
42860.59 |
59600.31 |
80959.37 |
107442.6 |
139819.4 |
|
|
434 |
2410.47 |
4590.64 |
8033.81 |
13097.4 |
20388.53 |
30475.03 |
43663.36 |
60554.45 |
82212.9 |
109227.4 |
142243.3 |
|
|
460 |
2465.81 |
4689.19 |
8234.12 |
13372.43 |
20751.01 |
30969.64 |
44385.67 |
61506.53 |
83565.46 |
110957 |
144665.5 |
|
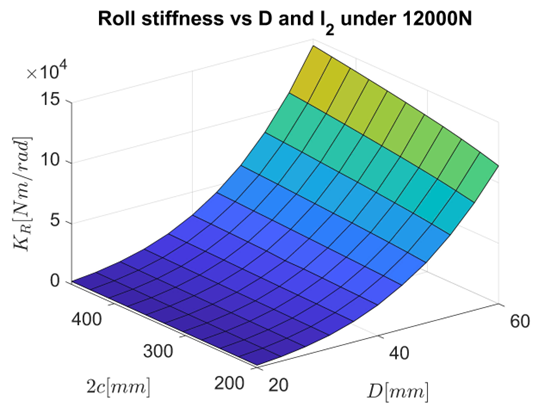
Fig. 14. Roll stiffness chart of anti-roll bar
As shown in Table 3 and Figure 14, the torsional stiffness of the anti-roll bar increases with both bar diameter and bushing spacing. According to previous research [5], [6], an optimal torsional stiffness range of 10000-50000 Nm/rad is recommended for medium-duty trucks. This range provides sufficient stability under varying load conditions while maintaining safety criteria.
4 Conclusions
This study investigates the impact of structural parameters on the performance of automotive anti-roll bars using finite element analysis. A 3D model of an anti-roll bar was created in Catia and analyzed in HyperMesh. From the figures and data tables, the safe design range of the anti-roll bar can be clearly identified. Observing the displacement distribution, it is evident that excessive displacement under a 12,000N load could lead to structural failure, while overly low displacement results in unnecessary overstrength. The selected material, 50CrV4 alloy steel, has a tensile strength of approximately 1,500 MPa and a yield strength of around 1,250 MPa, ensuring high durability and resistance to deformation. Based on these properties, only bar diameters between 36 mm and 44 mm with bushing placements between 350 mm and 400 mm satisfy strength requirements, maintaining structural integrity without excessive material use. Similarly, the stress distribution graph shows that stress values remain within a safe range in this design window, preventing material failure while ensuring efficient load distribution. The torsional stiffness chart confirms that a range of 25,000–50,000 Nm/rad is ideal for balancing vehicle stability and durability, which is best achieved with diameters between 40 mm and 44 mm and bushing distances of 350 mm to 400 mm.
These findings provide a strong reference for optimizing anti-roll bar design, ensuring improved vehicle stability while maintaining fatigue resistance. Future research should focus on optimizing the bar's geometry and material properties to achieve minimal weight and tailored torsional stiffness for various driving conditions.
Acknowledgements
The research is supported by the Ministry of Education and Training under grant number B2025-GHA-09.
References
- Tan, V. V., & Dang, H. N. (2022). Survey and assessment of the impacts of the passive anti-roll bars. Journal of Science & Technology, (6B). https://doi.org/10.57001/huih5804.912
- Tan, V. V., Sename, O., Gaspar, P., & Do, T. T. (2024). Active anti-roll bar control design for heavy vehicles. Springer. https://doi.org/10.1007/978-981-97-1359-2
- Jazar, R. N. (2025). Vehicle dynamics: Theory and application (4th ed.). Springer. ISBN: 978-3031744570
- Gao, J., & Wu, F. (2020). The study of optimization and matching to spring and antiroll bar stiffness of suspension for multiresponse target of whole vehicle under sine-swept steering input. Mathematical Problems in Engineering, 2020. https://doi.org/10.1155/2020/8820108
- SAE Spring Committee. (1996). Spring design manual. Society of Automotive Engineers. ISBN: 156091680X
- Bharane, P., Tanpure, K., & Kerkal, G. (2014). Optimization of anti-roll bar using Ansys Parametric Design Language (APDL). International Journal of Engineering Research and General Science, 2(5), 699–706.
- Topaç, M. M., Enginar, H. E., & Kuralay, N. S. (2011). Reduction of stress concentration at the corner bends of the anti-roll bar by using parametric optimisation. Mathematical and Computational Applications, 16(1), 148–158. https://doi.org/10.3390/mca16010148
- Sharma, K. K., Rashid, A., & Mandale, S. (2015). Analysis of anti-roll bar to optimize the stiffness. International Journal of Modern Trends in Engineering and Research (IJMTER), 2(7), 1874–1879.
- Bharane, P., Tanpure, K., Patil, A., & Kerkal, G. (2014). Design, analysis and optimization of anti-roll bar. Journal of Engineering Research and Applications, 4(9, Version 4), 137–140.
- Yachkal, A. K., Nath, N. K., & Khan, S. (2020). Analyses of the effect of clamping distance on stress and roll stiffness of anti-roll bar. International Journal of Applied Engineering Research, 15(9), 906.
- Mohanavel, V., Iyankumar, R., Sundar, M., Kumar, P. K., & Pugazhendh, L. (2020). Modelling and finite element analysis of antiroll bar using ANSYS software. Materials Today: Proceedings.
- Ribeiro, S. Y., & Silveira, M. E. (2013). Application of finite element method in the study of variables that influence the stiffness of the anti-roll bar and the body roll. SAE Technical Paper Series. https://doi.org/10.4271/2013-36-0643
- Khartode, A., & Gaikwad, M. (2016). Design and analysis of antiroll bars for automotive application. International Journal on Recent and Innovation Trends in Computing and Communication, 4(6), 340–345.
- Kumar, V., Chandrasekaran, T., Padmanabhan, M., Saravanan, S., & Arunkumar. (2020). Material and design parameters optimization to enhance the life of anti-roll bar of commercial truck. Materials Today: Proceedings. https://doi.org/10.1016/j.matrp.561
- Nikhil, M. K., & Daspute, D. H. (2018). Dynamic analysis of anti-roll bar. Materials Today: Proceedings, 5(5), 12490–12498. https://doi.org/10.1016/j.matpr.2018.02.
- Bhandiagare, S., Mali, T., Tangadpalliwar, S., & Baskar, P. (2016). Analysis of effect of polyurethane bushing on stress distribution of anti-roll bar. International Journal of Engineering Research and General Science, 4(3).
- Wheatley, G., & Zaeimi, M. (2022). Anti-roll bar design for a Formula SAE vehicle suspension. Scientific Journal of Silesian University of Technology. Series Transport, 116, 257–270. https://doi.org/10.20858/sjsutst.2022.116.17
- Kann, L. S., Tare, S. V., & Kalje, A. M. (2014). Feasibility of hollow stability bar. IOSR Journal of Mechanical and Civil Engineering (IOSR-JMCE), 76–80.
- Kumar, Y., Abad, R., Upadhyay, Y., & Prajapati, S. (2021). Kinematic and structural analysis of independent type suspension system with anti-roll bar for Formula Student Vehicle. Materials Today: Proceedings, October. https://doi.org/10.1016/j.matpr.2021.09.247
- Liu, X., Zhang, S., Chen, H., Yang, Y., Gao, K., Wang, Y., & Qi, W. (2017). Fatigue life analysis of automotive anti-roll bar based on FEA. Acta Technica, 62(4A), 547–554.
- Deshmukhpatil, S. B., & Maskar, P. D. (2021). Design optimization and analysis of composite automotive anti-roll bar. International Research Journal of Engineering and Technology, 8(6), 3746–3752.
- Alpar, M., Savran, E., & Karpat, F. (2024). Anti-roll bar optimization of an urban electric bus. Archives of Advanced Engineering Science. https://doi.org/10.47852/bonviewAAES42022250
- Vu, V. T. (2017). Enhancing the roll stability of heavy vehicles by using an active anti-roll bar system (Doctoral dissertation, University Grenoble Alpes, France).
- Tan, V. V., Sename, O., & Gáspár, P. (2021). Improving roll stability of tractor semi-trailer vehicles by using H∞ active anti-roll bar control system. Proceedings of the Institution of Mechanical Engineers, Part D: Journal of Automobile Engineering, 235(14), 3509–3520. https://doi.org/10.1177/09544070211013949
- Tan, V. V. (2021). Preventing rollover phenomenon with an active anti-roll bar system using electro-hydraulic actuators: A full car model. Journal of Applied Engineering Science, 19(1), 217–229. https://doi.org/10.5937/jaes0-28119
- Vu, V. T., Sename, O., Dugard, L., & Gaspar, P. (2016). Optimal selection of weighting functions by genetic algorithms to design H∞ anti-roll bar controllers for heavy vehicles. 15th Mini Conference on Vehicle System Dynamics, Identification and Anomalies (VSDIA 2016), Budapest, Hungary.
Conflict of Interest Statement
There are no conflicts affecting the research.
Author Contributions
Data Availability Statement
There is no dataset associated with the study or data is not shared.
Supplementary Materials
There are no supplementary materials to include.