Volume 24 number 1 article 1318 pages: 93-106
Received: Oct 22, 2025 Accepted: Jan 13, 2026 Available Online: Feb 09, 2026 Published: Mar 02, 2026
DOI: 10.5937/jaes0-62333
EXPERIMENTAL AND NUMERICAL STUDY OF TUNNEL VARIATIONS EFFECTS ON BLAST WAVE TRANSMISSION MECHANISM
Abstract
This study investigates the effects of tunnel configuration changes on blast pressure transmission under near-field explosion conditions using both experimental and numerical approaches. Small-scale models were employed to conduct explosion tests, including near-surface detonations and variations in tunnel patterns. Numerical simulations utilizing ALE (Arbitrary Lagrangian-Eulerian) fluid-structure interaction were performed to evaluate blast pressure transmission. The analysis revealed that elbow-type, T-type, and branched tunnels exhibited varying effects on blast pressure transmission, with significant differences in pressure between the inner and outer walls of the tunnels' bend sections. In elbow-type tunnels, the inner wall experienced greater blast pressure than the outer wall, whereas the opposite was observed in T-type and branched tunnels. The findings demonstrate that the numerical model accurately reflects experimental blast pressure transmission patterns.
Highlights
- Tunnel geometry strongly affects blast wave transmission and pressure redistribution.
- Inner wall pressure dominates in elbow tunnels, outer wall in T-type and branched tunnels.
- ALE-based numerical simulations accurately reproduced experimental blast pressure trends.
- Straight tunnel confinement increased entrance blast pressure by about 32%.
Keywords
Content
1 Introduction
Tunnels provide enhanced protection due to their covering soil and anti-penetration design. However, with advancements in projection weapon accuracy, tunnel entrances and exits have become primary targets. When a projectile detonates near these openings, the resulting blast pressure propagates through the tunnel, potentially exceeding the human body’s tolerance of 1.39 MPa, which can be fatal [1]. Numerical techniques have been widely used to study blast wave propagation and fluid-structure interactions. These methods are cost-effective and can provide valuable insights in a timely manner [2-6]. Tiwari et al. conducted a coupled Eulerian-Lagrangian (CEL) analysis using Abaqus software to examine the effects of internal blasts on circular underground tunnels [7]. Koneshwaran explored how tunnel depth, ground distance, and varying explosive weights of TNT influence the dynamic response of circular tunnels [8]. Britt and Little [9] conducted external explosion experiments in 1984 using small-scale steel square and circular tunnel models. They expanded their study to include T-shaped, 90-degree, and 45-degree corner tunnels. The U.S. military’s TM5-855-1 specification in 1986 introduced empirical formulas for estimating blast pressure transmission in different tunnel types [10]. In a 1992 study, Song et al. examined the effects of straight, elbow, and dead-end tunnels on blast pressure transmission using small-scale C4 detonation experiments [11]. Further studies by Scheklinski-Glück [12] and the Ernst Mach Institute [13] developed empirical models for predicting blast pressures at various points within tunnels. Smith et al. [14] demonstrated that rough wall surfaces could effectively reduce blast pressure transmission. McMahon and Taylor [15] analyzed how tunnel size and explosive quantity affected blast pressures, while Ishikawa and Beppu [16] studied the attenuation effects in straight, branched, and net-shaped tunnels.Research by Xiudi Li and Yingren Zheng [17] highlighted the influence of sparse, reflected, and diffracted waves on blast pressures near tunnel entrances. Zhong [18] and Bi [19] proposed prediction models for blast pressure attenuation in tunnels, emphasizing the complex interactions between detonation waves and tunnel geometry. Most studies focus on circular and arched tunnel cross-sections. However, rectangular sections, variable pipe diameters, and decompression devices warrant further investigation. This study aims to analyze the blast pressure transmission mechanisms in tunnels subjected to near-field explosions. Through experimental tests and numerical simulations, this research seeks to develop empirical formulas and provide recommendations for improving tunnel blast protection, serving as a reference for future tunnel design and retrofitting.
Recent studies have demonstrated that tunnel geometry, cross-sectional variation, and branching configurations significantly influence blast wave attenuation and pressure redistribution mechanisms [22-24, 26-29, 30]. Numerical investigations using finite element and coupled Eulerian–Lagrangian approaches further indicate that complex tunnel layouts may induce asymmetric pressure amplification at bending and branching sections [21, 23, 27, 28, 30]. However, most existing studies primarily focus on straight or circular tunnels, while the combined effects of tunnel geometry variations and near-field external explosions on pressure transmission mechanisms remain insufficiently investigated [22, 23, 26, 27]. Therefore, this study integrates small-scale explosion experiments and validated numerical simulations to systematically investigate blast wave transmission characteristics in straight, elbow, T-type, and branched tunnel configurations, providing quantitative insights for protective tunnel design [24, 25, 28–30].
2 Materials and methods
We assumed that the projectile weapon exploded at a distance of 12 m from the tunnel’s entrance. The amount of C4 explosives used was 800, 1200, 1600, 2000, and 2800 kg. The blast pressure generated was transmitted 40 m along the rectangular section of the tunnel (side length 6 m). The explosion experiment was carried out with a scale effect of 1/20. Therefore, the distance between the explosive source and the tunnel entrance is 60 cm. The amount of C4 explosive used was 100, 150, 200, 250, and 350 g. The rectangular tunnel had a total length of 200 cm, whereas the scale model had a side length of 30 cm. The impact of the blast pressure generated by the near-field explosion on the inside of the tunnel was analyzed. The experimental part was divided into three types and five experiments.
2.1 Near-ground explosion experiment
Five types of C4 explosive quantities (100, 150, 200, 250, and 350 g) were used in the near-ground explosion experiment. The explosives were hung at 30 cm above the ground. The pencil probe was configured in two ways to record the pressure time history. Firstly, it was set at 60 and 150 cm from the source of the explosion. The second time it was set at 90 and 230 cm from the source of the explosion. The distance values were based on the weight of the explosive and the measuring distance where the pen gauge was placed. The scale ranged from 0.85 to 4.95 m/kg1/3.
2.2 Effect of tunnel type change
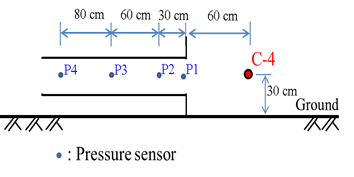
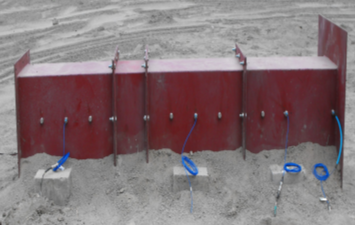
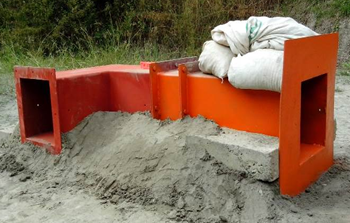
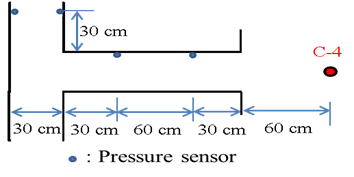
In analyzing the effect of tunnel type changes, the transmission and attenuation effects of the blast pressure in the four tunnel types were discussed. The experimental setup is shown in Figure 1.
- Straight tunnel explosion experiment
The straight tunnel was a rectangular section tunnel with a side length of 30 cm and a total length of 200 cm. The burst pressure gauge was installed on the side wall of the test body at 2, 30, 90, and 170 cm from the tunnel’s entrance. Using different explosive quantities, the blast pressure transmission in the tunnel changes. Five kinds of C4 explosives (100, 150, 200, 250, and 350 grams) were used. The explosives were 30 cm above the ground and 60 cm away from the tunnel’s entrance.
 |
 |
 |
 |
|
a. Straight tunnel |
b. Elbow tunnel |
 |
 |
 |
 |
| c. T-type tunnel | d. Branch-type tunnel |
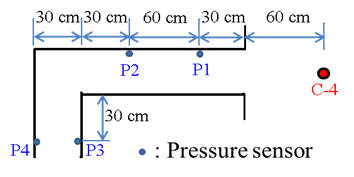
Fig. 1. The experimental setup
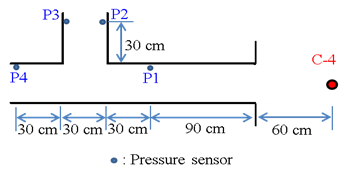
- Elbow tunnel explosion experiment
The cross-section size of the test specimen was the same as that of a straight tunnel. The elbow tunnel was composed of a straight section and a turning section. The straight section was 150 cm long, and the turning section was 40 cm long. The burst pressure gauges were installed on the side wall of the test body and were at 30 cm and 90 cm positions from the mouth and at 30 cm after the turning section on both sides. The experiment used two kinds of C4 explosives (10 and 250 grams) to understand the change of blast pressure transmission in the tunnel under different explosive quantity conditions. The explosive was placed 30 cm above ground 30cm and 60cm from the tunnel’s entrance. The elbow tunnel was a rectangular section tunnel with a side length of 30 cm. Two types of C4 explosives (100 and 250 grams) were used for the external explosion experiment of the tunnel. The burst pressure gauge was set on the inner side of the tunnel wall. The distance between the installation position and the tunnel opening was 30cm, 90cm, and 30cm on both sides after the turning section. The position of each burst pressure gauge is represented by P1 to P4. To understand the shape effects of pressure wave propagation in the elbow tunnel, the pressure gauges were positioned at P2, P3, and P4. The blast pressure measured was compared to P1 and P2 positions in the straight tunnel.
- T-type tunnel explosion experiment
The T-type tunnel test specimen by a straight-line segment and T-branch segment was composed of long linear segments of 150 cm. The T-branch section (unilateral) length was 40 cm. A burst pressure test gauge was mounted on the side wall at 30 cm from the tunnel exit. The 90 cm position and the T-shaped tunnel were on both sides of 30 cm after turning. The experiment used two kinds of C4 explosives (100 and 250 grams). These explosives were hoisted 30cm above the ground and detonated at a distance of 60 cm from the opening of the tunnel. The T-shaped tunnel was a rectangular section tunnel with a side length (D) of 30 cm. The tunnel was divided into straight sections and T-shaped branch sections. The straight section was 150 cm long, and the T-shaped branch section was 40 cm long (T-shaped unilateral). Two types of C4 explosives (100 and 250 grams) were used for the external explosion experiment of the tunnel. The burst pressure gauge was set on the inner side of the tunnel wall, and the distance from the tunnel opening was 30 cm, 90 cm, and 30 cm on both sides of the T-branch. The position of each burst pressure gauge is represented by P1 to P4. The pressure gauges were positioned at P2, P3, and P4 to understand the shape effects of pressure wave propagation in the T-type tunnel. The blast pressures measured at P1 and P2 were compared to those recorded in the straight tunnel.
- Branch-type tunnel explosion experiment
The size of the experimental test body and the tunnel section was the same as the straight tunnel. The branch tunnel test body was divided into straight and branch sections. The length of the straight section was 190 cm, and the branch section was 40 cm. The branch section was set to the side of the tunnel, opening from 120 cm to 150 cm. The burst pressure gauge was installed on the side wall of the test body 90 and 180cm away from the entrance of the tunnel and 30cm on both sides of the branch section. The experiment used two kinds of C4 explosives (100 and 250 grams) placed 30 cm above ground at a distance of 60cm from the tunnel exit. To understand the effect of the branched transmission of burst pressure near the branched tunnel, the burst pressure was compared. This compared the burst pressures of P2 and P3 with P1. Then, the values of P4 and P1 were compared. At the same time, the blast pressures measured at the P1 position of the branch and straight tunnels were compared to explore the difference in blast pressure between the two tunnel types.
2.3 Numerical model
The numerical simulation used LS-DYNA finite element analysis software to simulate the blast pressure transfer and attenuation after the explosion and analyzed the changes in the tunnel type and the blast pressure transfer of the decompression module. To improve the accuracy of detonation pressure in close-range explosions in numerical simulations, the calculations are usually carried out using finer mesh sizes and ALE multi-material fluid-solid coupling. However, as the number of meshes increases, the derivative analysis model and mesh size are affected. To solve this problem, the LS-DYNA mapping technique was used.
- Numerical model of tunnel type change
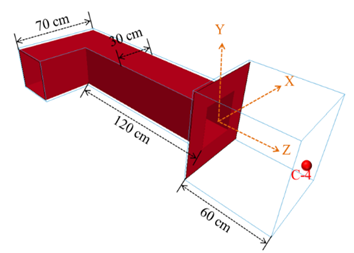
According to the experimental model project, to maintain the symmetry of the linear and T-type pit props, this study adopted a 1/2 symmetric simplified numerical analysis. Meanwhile, a full model analysis was conducted for the folding type and the branch type mining tunnels. The corresponding models are illustrated in Figure 2.
Fig. 2. Schematic diagram of the numerical model of tunnel type changes
2.4 Material composition ratio
Numerical simulation was carried out for the tunnel type change experiment, using air, explosives, steel plates, and other materials. The material composition law is explained as follows:
- Air
Air materials LS-DYNA number 9 No. Mat_Null material mode. Since a large volume of air material changes during the detonation reaction, the combination of the equation of state to describe the volume, stress, and strain relationship material, air state equation using Eos_Linear_Polynomial, is as follows:
| $P = C_0 + C_1 \mu + C_2 \mu^2 + C_3 \mu^3 + \left( C_4 + C_5 \mu + C_6 \mu^2 \right) E_0 $ | (1) |
| $\mu = \frac{\rho_{\text{current}}}{\rho_{\text{initial}}} - 1$ | (2) |
This state equation comprises initial internal energy per unit reference specific volume and air density changes . Assuming that gas is an ideal gas $C_0, \ C_1, \ C_2, \ C_3$ and $C_6$ can be set to zero, and to make $C_4 = C_5 $ equal $\gamma - 1 $, the following simplified equation of state is presented.
| $p = (\gamma - 1) \frac{\rho_{\text{current}}}{\rho_{\text{initial}}} E_0 $ | (3) |
| $E_0 = e \, \rho_{\text{initial}} $ | (4) |
Among them, $\rho_{\text{initial}} $ is the initial density of the air (initial density), $\rho_{\text{current}} $ is the current density of the air (current density), and e is the internal energy of the air.
- Explosives
The explosive material adopts the MAT_HIGH_EXPLOSIVE_BURN material mode No. 8 in the LS-DYNA program. It can simulate high energy explosives. It matches the JWL state equation number 2 in the LS-DYNA program.
| $P = A \left( 1 - \frac{\omega}{R_1 V_r} \right) e^{-R_1 V_r} + B \left( 1 - \frac{\omega}{R_2 V_r} \right) e^{-R_2 V_r} + \frac{\omega E_0}{V_r} $ | (5) |
A, B, R1, R2, ω, λ, and other parameters are all equation coefficients. P is pressure, Vr is the relative volume (initial relative volume), and Eo is the initial internal energy per unit reference-specific volume.
- Steel plate
Section steel materials were used for the numbering. No. 3 Mat_Plastic_Kinematic material is the numerical simulation model. The material for the bilinear model stress-strain relationship was the steel materials to simulate elastic and plastic behavior. The strain hardening behavior of the plastic material into the Etan: if Beta = 0, that is the dynamic plastic hardening material (the Kinematic the hardening), if Beta = 1, a strain hardening compared to the other material (the hardening isotropic). In addition to unloading at the original slope of the dynamic plastic and the isotropic plastic hardening curves, the yield stress value of the dynamic plastic hardening curve will be reduced by the same amount, and the yield stress of the isotropic plastic hardening curve will increase at the same time [19].
3 Results and discussion
3.1 Explosion near the ground
Experimental results provide free air according to the US explosion specification and an explosion surface empirical formula [20]. According to the analysis of the scale from the detonation pressure measurement data-related properties, the correlation coefficient was -0.78. In the display with the scale increasing distance, burst pressure will be significantly attenuated. The regression analysis was used to obtain the relationship between critical pressure and scale distance as shown by Formula (6) which is the regression formula of this experiment with the coefficient of determination R2 =0.98.
| $p_{\text{so}} = 1205.946407 \, Z^{-1.984571} \ \text{kPa}$ | (6) |
3.2 Analysis of the effect of tunnel type changes
- Straight tunnel explosion
The linear internal pressure of the tunnel burst attenuation result changes is shown in Table 1 below. It can be seen from the experimental results that the transmission of blast pressure in the tunnel will decrease with distance. To explore the effect of the blast pressure affected by the tunnel enclosure, the position of the linear tunnel blast pressure gauge P1 was taken as an example. When the C4 explosive was 100 grams, the measured blast pressure was 739.89 kPa, compared to the pure near-ground explosion distance. The explosion source at 60cm (detonation pressure gauge P1 position) measured a burst pressure of 613.92 kPa. The blast pressure change rate, defined as the fraction of a linear tunnel blast pressure and a pure blast pressure exploded near the ground, was 1.21. When the charge was changed from 150 to 350 grams, the blast pressure change rate at the same P1 position was 1.22 and 1.57, respectively. Therefore, in the straight tunnel P1 position, the average blast pressure change rate was 1.32. The blast pressure near the ground confinement conditions in tunnels could increase burst pressure by 32%; this result is closed to 1.5 times of the empirical value provided in the US specification TM5-855-1. From the experimental result, blast pressure and confinement tunnel affected the superposition reflection effect relative to a pure explosion near the ground.
Table 1. Comparison table of blast pressure measurement of Straight tunnel
|
Weight of explosive C4(g) |
100 |
150 |
200 |
250 |
350 |
|||
|
Pressure gauge location |
P1 (L/D=0.07) |
Near ground explosion (60cm) |
Pressure (kPa) |
613.92 |
1129.15 |
1132.64 |
1400.67 |
1750.09 |
|
Linear tunnel |
Pressure (kPa) |
739.89 |
1377.66 |
1781.53 |
1891.12 |
2173.99 |
||
|
Blast pressure change rate* |
1.21 |
1.22 |
1.57 |
1.35 |
1.24 |
|||
|
Average |
1.32 |
|||||||
|
P2 (L/D=1.00) |
Near ground explosion (90cm) |
Pressure (kPa) |
241.27 |
308.5 |
527.89 |
657.85 |
827.1 |
|
|
Linear tunnel |
Pressure (kPa) |
514.00 |
641.08 |
675.73 |
776.92 |
1218.14 |
||
|
Blast pressure change rate* |
2.13 |
2.08 |
1.28 |
1.18 |
1.47 |
|||
|
Average |
1.63 |
|||||||
|
P3 (L/D=3.00) |
Near ground explosion (150cm) |
Pressure (kPa) |
117.04 |
147.19 |
193.94 |
213.51 |
278.52 |
|
|
Linear tunnel |
Pressure (kPa) |
333.56 |
395.62 |
439.26 |
498.92 |
709.34 |
||
|
Blast pressure change rate* |
2.85 |
2.69 |
2.26 |
2.34 |
2.55 |
|||
|
Average |
2.54 |
|||||||
|
P4 (L/D=5.67) |
Near ground explosion (230cm) |
Pressure (kPa) |
53.19 |
64.22 |
84.00 |
93.52 |
118.53 |
|
|
Linear tunnel |
Pressure (kPa) |
271.77 |
362.20 |
386.13 |
448.67 |
571.91 |
||
|
Blast pressure change rate* |
5.11 |
5.64 |
4.60 |
4.80 |
4.83 |
|||
|
Average |
5 |
|||||||
|
*rate of change of blast pressure |
||||||||
To understand the change in attenuation of the tunnel burst pressure, at the entrance of the tunnel burst pressure gauge P1 position (L / D = 0.07), the burst pressure normalized. Using statistical regression analysis, the empirical formula was proposed for the linear tunnel burst pressure attenuation rate (Pdr = Pdecrease ratio). Its determination coefficient R 2 =0.89, as shown in equation (7). This empirical formula can be determined from the tunnel entrance (L /D=0.07) to calculate the blast pressure at any distance in the tunnel and provide a reasonable and rapid prediction.
| $P_{\text{dr}} = 0.452997 \left(\frac{L}{D}\right)^{-0.306656}$ | (7) |
To explore the difference between different transmission paths of the blast pressure in the linear tunnel, two different transmission paths (StraightA, StraightB) were used for the discussion in the numerical simulation part. Where StraightA was along the sidewall of the tunnel, and StraightB was the central axis of the tunnel. Simulation results obtained were compared with the empirical ones and shown in Figure 3. The simulation results show the detonation pressure within the trenches exhibits attenuation with distance, and Numerical simulation and blast pressure damping similar trend. Considering the difference in burst pressure of different paths, it was found that the difference in burst pressure distribution between StraightA and StraightB was not significant. The main reason is that the two paths were not far apart (distance).
 |
 |
| 100g C4 | 150g C4 |
 |
 |
| 200g C4 | 250g C4 |
 |
|
| 300g C4 |
Fig. 3. Comparison of blast pressure between linear tunnel explosion experiment and numerical simulation
- Elbow tunnel explosion
This experiment tunnel burst pressure inside the measurement results in an attenuation change is shown in Table 2 below. Comparing the experimental results with the TM5-855-1 (1986) results, the blast pressure transfer rate of the tunnel’s inner and outer sides varied with the tunnel types. The pressure measured at P3 on the elbow tunnel’s inner side wall shows that the pressure transfer rate was 0.99 compared to the straight tunnel. P4 on the outer side wall of the elbow tunnel, the pressure transfer rate was 0.87 of the straight tunnel. The burst pressure transfer rate at the P3 and P4 positions was 0.93 times on average (blast pressure attenuation was 7%). The empirical formula provided 0.94 times the burst pressure transfer rate for the elbow tunnel. The experimental value was similar to that from the empirical formula. However, the empirical formula did not describe in detail the calculation standard of burst transfer rate for the relative distance before and after the turning section, and the difference in burst transfer rate between the two sides of the tunnel. Although the empirical formula provides rapid blast pressure conversion, the blast pressure on the experiment’s inner side wall (P3) was greater than on the outer side wall (P4). This phenomenon can be incorporated into the design of bending tunnels for reference.
To understand the difference between the blast pressure of the bent and straight tunnels, the blast pressures captured by the positions of the blast pressure gauges P1 and P2 were compared by taking the position of blast pressure gauge P1 as an example. When the C-4 explosive was 100 grams, the blast pressure measured by the elbow tunnel was 590.97 kPa, while the blast pressure measured by the straight tunnel was 514.00 kPa. The blast pressure changes and the rate of change were 1.15 times (burst pressure change rate = elbow tunnel burst pressure / straight tunnel burst pressure). Under 250 grams of explosives, the burst pressure change rate was 0.97 times, with an average of 1.06 times. Table 3, The blast pressure captured by the two tunnel types at the pressure gauge P1 position was slightly the same. At the P2 position at 100 and 250 grams of explosives, the blast pressure change rate was 0.73 and 0.81 times, respectively, 0.77 times on average. Therefore, the total blast pressure change rate of P1 and P2 was 0.92 times. This shows that the blast pressure measurement results of the two types of tunnels were not much different before the blast pressure was transmitted to the tunnel bending.
Table 2. Comparison table of blast pressure measurement of bending tunnel
|
Weight of explosive C4 (g) |
100 |
250 |
|||
|
Pressure gauge location |
P1 (30 cm) |
Experiment |
Pressure (kPa) |
590.97 |
759.52 |
|
Simulation |
Pressure (kPa) |
590.54 |
966.78 |
||
|
P2 (90 cm) |
Experiment |
Pressure (kPa) |
244.62 |
406.08 |
|
|
Simulation |
Pressure (kPa) |
417.34 |
658.12 |
||
|
P3 (180 cm) |
Experiment |
Pressure (kPa) |
244.74 |
395.2 |
|
|
Blast pressure transfer rate* (times) |
1.00 |
0.97 |
|||
|
0.99 |
|||||
|
Simulation |
Pressure (kPa) |
344.19 |
586.59 |
||
|
Blast pressure transfer rate* (times) |
0.82 |
0.89 |
|||
|
0.86 |
|||||
|
P4 (210 cm) |
Experiment |
Pressure (kPa) |
213.15 |
354.49 |
|
|
Blast pressure transfer rate* (times) |
0.87 |
0.87 |
|||
|
0.87 |
|||||
|
Simulation |
Pressure (kPa) |
282.96 |
441.81 |
||
|
Blast pressure transfer rate* (times) |
0.68 |
0.67 |
|||
|
0.67 |
|||||
|
* Blast pressure transfer rate = Simulation (P3, P4) Pressure / Simulation (P2) Pressure |
|||||
Simulation and experimental results are presented as comparative detonation pressure in Figure 4. The simulation results show that the blast pressure in the tunnel attenuated as the distance increased. When the detonation pressure was transmitted to the bending, the inner side wall (P3) burst pressure was greater than the outer sidewall (P4). The numerical simulation and the experimental burst pressure attenuation trend were similar.
Fig. 4. Comparison of blast pressure between the explosion experiment and the numerical simulation of the elbow tunnel (a)100g (b)250g
- Explosion test results of T-type tunnel
T-type tunnel detonation pressure inside the tunnel-type attenuation changes as in Table 3. Comparing the experiment with the empirical formula, the burst pressure transmission rate at the P3 position of the experiment was 0.88 times, and the transmission rate at the P4 position was 1.25 times. If the burst pressure transmission rates at the P3 and P4 positions were comprehensively calculated, the average was 1.07 times. The burst pressure transmitted from the P2 position to the P3 and P4 position increased the detonation pressure slightly to 7%. The TM5-855-1 empirical formula provided a T-critical pressure ratio of the transmission tunnel type 0.80 -fold (detonation pressure decay to 20%), and the other UFC 3-340-01 empirical formula aspect, to burst a potentiometer P2 into the empirical formula. T after the detonation pressure branch tunnel type transfer values were 188.82 and 299.38 kPa. The burst pressure transmission rate was 0.72 times (the burst pressure attenuation is 28%). The two empirical formulas of TM5-855-1 and UFC 3-340-01 both exhibit attenuation after the branch of the T-shaped tunnel. This was similar to experiments P3 and P4 average burst pressure of transmissibility of the two positions (1.07 -fold), which did not match. Only the experimental side wall (P3) of the transmitted burst pressure of 0.88 times the empirical formula was similar to the value from the empirical formula. Further exploration of the experiments indicated that the T-type branch tunnel outer wall (P4) sustained greater blast pressure than the inner wall of the branch (P3). This is a phenomenon not mentioned in the empirical formula. The reason behind this phenomenon might be that the empirical formula is for a quick and simple solution, which only provides a single reference value and does not distinguish the branches of the T-shaped tunnel. If the blast pressure transfer reaction of the latter two side walls was used in tunnel design or safety assessment, the estimated blast pressure might be low and causes safety concerns. Therefore, according to the experimental blast pressure attenuation phenomenon, in the T-shaped tunnel analysis, numerical simulation results should be incorporated into the reference to increase the accuracy of the analysis.
To understand the difference between the blast pressure of the T -shaped and linear tunnels, the blast pressures captured by the positions of the blast pressure gauges P1 and P2 were compared. In burst pressure gauge at the P1 position, for example, T-type tunnel P1 burst pressure measurement value of 556.39 kPa with 100grams C-4 explosive was compared to linear-type tunnel P1 burst pressure of the measurement of 514.00 kPa, in which the blast pressure change rate was 1.08 times (the blast pressure change rate =T tunnel blast pressure / straight tunnel blast pressure). When the explosive volume was 250 grams, the blast pressure change rate was 0.94 times. Therefore, the blast pressure at point P1, the rate of change was 1.01 times on average. The blast pressure captured by the two types of tunnels at the same location was the same. The burst pressure at the P2 position with 100 and 250 grams of explosives, the rate of change of blast pressure was 0.79 and 0.84 times, respectively. The average was of 0.82 times. Pl and P2 burst rate of change of the total pressure 0.92 times. The detonation pressure was transmitted to the T before the branch tunnel type. The two kinds of the same type of tunnel burst pressure measurement results were schematic.
Table 3. Comparison table of T-type tunnel blast pressure measurement
|
Weight of explosive C4 (g) |
100 |
250 |
|||
|
Pressure gauge location |
P1 |
Linear-type |
Pressure (kPa) |
514.00 |
776.92 |
|
T-shaped |
Pressure (kPa) |
556.39 |
729.05 |
||
|
Blast pressure change rate1 (times) |
1.08 |
0.94 |
|||
|
1.01 |
|||||
|
P2 |
Linear-type |
Pressure (kPa) |
333.56 |
498.92 |
|
|
T-shaped |
Pressure (kPa) |
264.05 |
418.66 |
||
|
Blast pressure change rate1 (times) |
0.79 |
0.84 |
|||
|
0.82 |
|||||
|
P3 |
T-shaped |
Pressure (kPa) |
216.54 |
395.35 |
|
|
Blast pressure transfer rate2 (times) |
0.82 |
0.94 |
|||
|
0.88 |
|||||
|
P4 |
T-shaped |
Pressure (kPa) |
287.09 |
592.44 |
|
|
Blast pressure transfer rate2 (times) |
1.09 |
1.41 |
|||
|
1.25 |
|||||
|
¹Blast pressure change rate= T-shaped(P1, P2) Pressure/ Linear-type(P1, P2) Pressure ²Blast pressure transfer rate= T-shaped(P3, P4) Pressure/ T-shaped(P2) Pressure |
|||||
Numerical simulation part, T-type numerical simulation results with experimental tunnel burst pressure are shown as a comparison in Figure. 5. When the blasting pressure was transmitted to the T before the branch tunnel type, the tunnel burst pressure exhibits attenuation with distance. After the T-shaped branch, the blast pressure of the outer wall (P4) was greater than that of the inner wall (P3). Numerical simulation was consistent with the experimental blast pressure measurement trend.
Fig. 5. Comparison of blast pressure between T-shaped tunnel explosion experiment and numerical simulation(a)100g (b)250g
- Explosion test results of supporting tunnels
The branched internal tunnel burst pressure measurement results and attenuation change as in Table 4. Experimental comparison with the empirical formula on the branch transition illustrates the burst pressure of the straight section of the transmission. For comparing the first branch transition, the burst pressure transmitted from the P2 position was 0.50 times, and the P3 position transfer rate was 1.06 times. Based on a comprehensive calculation of the blast pressure transmission rates at positions P2 and P3, the average was 0.78 times. When the blast pressure was transmitted from position P1 to positions P2 and P3, the blast pressure is attenuated by 22%.
TM5-855-1 empirical formula yielded the detonation pressure delivery rate of 0.50 times for the branch type tunnel turning. From the aspect of the UFC 3-340-01 empirical formula, the two blast pressure values at the P1 position were substituted into the empirical formula. After the branch tunnel turns, the blast pressure transmission values were 86.25 and 149.20 kPa, respectively. The average blast pressure transmission rate was 0.30 times. The two empirical formulas predict the blast pressure by TM5-855-1. The value was conservative and close to the experimental result.
In comparing the straight branch section, the experimental P4 burst transmission position of the pressure was 0.63 -fold (detonation pressure decay 37%), while TM5-855-1 provided empirical formula branched straight segment was transmitted burst pressure 0.80 times in the UFC 3. In terms of the empirical formula of 340-01, the two blast pressure values at position P1 were substituted into the empirical formula. The blast pressure values of the straight section were214.70 and 357.33 kPa, respectively. The blast pressure transmission rate was 0.74 times (blast pressure attenuation 26%). P4 burst pressure transfer rate and a position of the UFC 3-340-01 empirical formula were similar.
Comparing the blast pressure attenuation at the branch turn and the straight section, the blast pressure attenuation amplitude after the turn (burst pressure attenuation 22%) was smaller than the straight section (burst pressure attenuation 37%), while the empirical formula was the opposite. Both TM5-855-1 and UFC 3-340-01 after the branch transition have a blast pressure attenuation amplitude (blast pressure attenuation of 50% and 70%, respectively) greater than that of the straight section (blast pressure attenuation of 20% and 26%, respectively). The empirical formula is different. If the experiment only considered the blast pressure attenuation amplitude of the inner wall (P2) after the branch turns (blast pressure attenuation 50%), the blast pressure attenuation trend of the experiment and the empirical formula was consistent. The main reason is that the empirical formula only provides a single reference value. It does not distinguish between the blast pressure transfer reaction on the two side walls after the branch. The estimated blast pressure value may be low. Therefore, while analyzing the tunnel branching effect, the blast pressure attenuation phenomenon of the experiment in this section should be considered. The numerical simulations were mutually verified to increase the accuracy of the analysis.
To understand the difference between the blast pressure of the branched and linear tunnels, the position of the blast pressure gauge P1 in the two types of tunnels was compared. When the C-4 explosive was 100 grams, the blast pressure measured by the branch tunnel was 300.25 kPa, whereas for the straight tunnel P1 it was 333.56 kPa. The blast pressure change rate was 0.90 times. The change rate equals the ratio of branch and straight tunnels blast pressures. When the explosive volume was 250 grams, the blast pressure change rate was 0.95 times. Therefore, the average blast pressure change rate at point P1 was 0.93 times, as could be illustrated by Table 5. This shows little difference between the blast pressure measurement results of the two tunnel types before the blast pressure was transmitted to the tunnel branch.
Simulation and experimental results are presented as Comparative detonation pressure in Figure 6. The simulation results show that when the detonation pressure was transmitted to the branch transition, an outer sidewall transition branch (P3) of the side wall was greater than the critical pressure (P2). The burst pressure was transmitted to the branch. In the straight section (P4), the blast pressure value at position P4 was greater than that at position P2 but less than position P3. The numerical simulation was consistent with the experimental blast pressure measurement trend.
Table 4. Comparison table of blast pressure measurement of branch tunnel
|
Weight of explosive C4 (g) |
100 |
250 |
|||
|
Pressure gauge location |
P1 |
Linear-type |
Pressure (kPa) |
333.56 |
498.92 |
|
Branch |
Pressure (kPa) |
300.25 |
472.51 |
||
|
Blast pressure change rate1 (times) |
0.90 |
0.95 |
|||
|
0.93 |
|||||
|
P2 |
Branch |
Pressure (kPa) |
147.66 |
237.05 |
|
|
Blast pressure transfer rate2 (times) |
0.49 |
0.50 |
|||
|
0.50 |
|||||
|
P3 |
Branch |
Pressure (kPa) |
308.05 |
523.81 |
|
|
Blast pressure transfer rate2 (times) |
1.02 |
1.10 |
|||
|
1.06 |
|||||
|
P4 |
Branch |
Pressure (kPa) |
180.94 |
307.82 |
|
|
Blast pressure transfer rate2 (times) |
0.60 |
0.65 |
|||
|
0.63 |
|||||
|
¹Blast pressure change rate = Branch (P1) Pressure / Linear-type(P1) Pressure ²Blast pressure transfer rate = Branch (P2, P3, P4) Pressure / Branch (P1) Pressure |
|||||
Fig. 6. Comparison of blast pressure between branch tunnel explosion experiment and numerical simulation (a)100g (b)250g
4 Conclusions
- Based on the results of linear tunnel explosion experiments, an empirical formula for the rate of change of blast pressure attenuation in the tunnel (Pdr = Pdecreaseratio) was established. The applicable range was L/D=0.07 to 5.67. This empirical formula can be used at the entrance of the tunnel. To provide a reasonable and fast prediction, blast pressure helped calculate the blast pressure value at any distance in the tunnel.
- Linear tunnel explosion experiment at L/D=0.07, compared to the blast pressure at 60 cm near the ground, the blast pressure in the tunnel increased by 32%. The near-ground explosion experience formula can convert to this multiplier. The blast pressure at the tunnel's entrance was combined with the empirical formula of P dr to further calculate the blast pressure at any distance within the tunnel.
- According to the analysis of tunnel type changes, it was found that the three types of tunnels, such as elbow, T, and branched tunnels have different degrees of impact on the transmission of blast pressure. After the turn in the elbow tunnel, the experimental analysis of the blast pressure attenuation was 7%, TM5-855-1. The estimated blast pressure attenuation was 6%. After the T-shaped tunnel branch, the experimental analysis of blast pressure increased by 7%. TM5-855-1 experience value blast pressure attenuated by 20%, and UFC 3-340-01 blast pressure attenuation was 28%. After the turn in the branch tunnel, the experimental analysis of the blast pressure attenuation was 22%, the TM5-855-1 blast pressure attenuation was 50%, and the UFC 3-340-01 blast pressure attenuation was 70%. For a straight section, the experimental pressure attenuation was 37%, TM5-855-1 blast pressure attenuation was 20%, and UFC 3-340-01 blast pressure attenuation was 26%.
- The experimental analysis on the blast pressure transfer response of the elbow, T -shaped, and branched tunnels found that the two side walls of the tunnel bend or branched have different blast pressures. Among them, the inner wall of the elbow tunnel was attenuated by the blast pressure. 1%, the outer wall was 13% attenuation of blast pressure. The inner wall of the T-shaped branch was 12% blast pressure attenuation, and the outer wall was a 25% increase in blast pressure. After the turn in the branched tunnel, the inner and outer walls register 50% attenuation in the blast pressure. Blast pressure was increased by 6%. The bending tunnels had a larger blast pressure on the inner wall after bending than the outer walls, while T-shaped and branched tunnels were the opposite. After the tunnel was branched, the blast pressure of the inner wall was smaller than the outer wall. In the analysis, only a single reference value of the empirical formula was considered. The results of the blast pressure analysis may not be conservative.
- Numerical simulation results of four types of tunnels show that the blast pressure attenuation trend was consistent with the experiment. Through simulation, we can understand the detailed situation of the blast pressure transmission in the tunnel. The reason and location of the blast pressure surge caused by the change of the tunnel type can also be understood. In addition to strengthening the deficiencies of the empirical formula, the analysis results can also be used as a reference for protection design.
Acknowledgements
No external funding was received for this research.
References
- Department of Defense, (2014) Structures to Resist the Effects of Accidental Explosions, UFC 3-340-02, USA.
- W. F Yu, C. W. Hung, and D. S. Cheng, (2010) “Effect of Blast wall on Safety Distance of Ammunition Storage Magazine Subjected to Internal Explosion,” Journal of Chung Cheng Institute of Technology 39, 131-145.
- S. J. Pi, D. S. Cheng, H. L Cheng, W. C. Li, and C. W. Hung, (2012) “Fluid-Structure- Interaction for a Steel Plate subjected to Non-Contact Explosion,” Theoretical and Applied Fracture Mechanics 59, 1-7.
- C. W. Hung, Y. K. Tsai, T. A. Chen, and P. W. Wu, (2020) “An experimentally validated numerical model for the near-field explosion of an ammunition storage magazine,” Applied Sciences 10(19), 6849.
- C. W. Hung, H. H. Lai, B. C. Shen, P. W. Wu, and T. A. Chen, (2020) “Development and Validation of Overpressure Response Model in Steel Tunnels Subjected to External Explosion,” Applied Sciences 10(18), 6166.
- C. W. Hung, Y. K. Tsai, T. A. Chen, H. H. Lai, and P. W. Wu, (2021) “Numerical Study of Pressure Attenuation Effect on Tunnel Structures Subjected to Blast Loads,” Applied Sciences 11(12), 5646.
- R. Tiwari, T. Chakraborty, V. Matsagar, (2014) Dynamic analysis of underground tunnels subjected to internal blast loading. 11th World Congress of Computational Mechanics (WCCM XI), Barcelona, Spain, 1-7.
- S. Koneshwaran, (2014) Blast response and sensitivity analysis of segmental tunnel. Ph. D. Desertation, Queensland University of Technology, Australia.
- J. R. Britt, and C. D. Little. (1984) Airblast Attenuation in Entranceways and other Typical Components of Structures: Small-Scale Tests Data Report 1, U. S. Army Corps of Engineers, Report No. ADA157002, USA.
- Department of the Army, (1986) Design and Analysis of Hardened Structures to Conventional Weapons Effects , TM5-855-1, USA.
- S. Y. Song, J. Lee, J. W. Ahn, H. W. Kim, and J. S. Choi, (1992) Effect of Blast Traps on Air-blast Propagation in Underground Storage, Minutes of the Twenty-fifth Explosives Safety Seminar, Anaheim, USA, 85-98.
- Department of the Army, (1998) Design and Analysis of Hardened Structures to Conventional Weapons Effects, TM5-855-1, USA.
- P. D. Smith, P. Vismeg, L. C. Teo, and L. Tingey, (1998) “Blast Wave Transmission Along Rough-Walled Tunnels,” International Journal of Impact Engineering , 21(6), 419-432.
- G. W. McMahon, and S. R. Taylor, In-Tunnel Airblast From Near Portal Detonations, ERDC Report, USA.
- N. Ishikawa, and M. Beppu, (2007) “Lessons from past explosive tests on protective structures in Japan,” International Journal of Impact Engineering, 34(9) 1535-1545.
- X. Li and Y. Zheng, “Experiment of shock wave impulse propagation model in tunnels,” Journal of PLA University of Science and Technology, 8(5), 425-428 .
- Z. N. Zhong (2011) Experiment and Numerical Simulation of Explosion Outside the Tunnel, Master thesis, Chung Cheng Institute of Technology, National Defense University, Taoyuan, ROC.
- Y. H. Bi, (2013) Numerical Simulation and Verification of Blast Pressure Transmission in Tunnels, Master thesis, Chung Cheng Institute of Technology, National Defense University, Taoyuan, ROC.
- LS-DYNA_Manual_Volume_I_R13 (2021), Livermore Software Technology (LST), AN ANSYS COMPANY, USA.
- Department of Defense, Unified facilities criteria, (2002) Design and Analysis of Hardened Structures to Conventional Weapons Effects, UFC 3-340-01, USA.
- Lu, Y., Wang, Z., Chong, K. P. (2012). A comparative study of buried structure response to blast loads using different numerical methods. International Journal of Impact Engineering, 46, 14–28.
- https://doi.org/10.1016/j.ijimpeng.2012.02.003
- Yang, Y., Wang, Z., Li, J. (2016). Numerical investigation of blast wave propagation in underground tunnel structures. Tunnelling and Underground Space Technology, 59, 37–47. https://doi.org/10.1016/j.tust.2016.05.010
- Li, X., Li, Q. M. (2018). Attenuation characteristics of blast waves in underground tunnels with varying cross-sections. International Journal of Rock Mechanics and Mining Sciences, 105, 96–108.https://doi.org/10.1016/j.ijrmms.2018.03.012
- Zhou, Y., Hao, H. (2017). Dynamic response and damage assessment of underground structures subjected to blast loading. Rock Mechanics and Rock Engineering, 50, 317–332.https://doi.org/10.1007/s00603-016-1085-6
- Ngo, T., Mendis, P., Gupta, A., Ramsay, J. (2007). Blast loading and blast effects on structures – An overview. Electronic Journal of Structural Engineering, Special Issue, 76–91.
- Zhang, R., Hao, H., Shi, Y. (2022). Blast wave propagation and attenuation in underground tunnel systems with complex geometries. Tunnelling and Underground Space Technology, 121, 104350.
- https://doi.org/10.1016/j.tust.2021.104350
- Wang, X., Li, Q. M., Zhou, Y. (2022). Dynamic response of underground structures subjected to near-field blast loading. International Journal of Rock Mechanics and Mining Sciences, 154, 105095. https://doi.org/10.1016/j.ijrmms.2022.105095
- Chen, S., Hao, H., Zhang, X. (2023). Numerical investigation on blast-induced pressure redistribution in underground structures. Rock Mechanics and Rock Engineering, 56, 2119–2136. https://doi.org/10.1007/s00603-022-03035-9
- Li, Y., Wu, C., Wang, Z. (2024). Effects of tunnel branching on blast wave attenuation and pressure amplification. Tunnelling and Underground Space Technology, 145, 105531. https://doi.org/10.1016/j.tust.2024.105531
- Zhao, J., Zhang, Y., Hao, H. (2021). Numerical simulation of blast wave transmission in underground structures considering geometric effects. International Journal of Impact Engineering, 153, 103852.https://doi.org/10.1016/j.ijimpeng.2021.103852
Conflict of Interest Statement
The authors declare that they have no known competing financial interests or personal relationships that could have appeared to influence the work reported in this paper.
Author Contributions
Data Availability Statement
The data that support the findings of this study are available from the corresponding author upon reasonable request.
Supplementary Materials
There are no supplementary materials to include for this study.