Volume 23 article 1303 pages: 675-687
Received: Apr 24, 2025 Accepted: Nov 20, 2025 Available Online: Dec 10, 2025 Published: Dec 15, 2025
DOI: 10.5937/jaes0-58449
GEAR TEETH OF BALL MILLS: WEAR, RESTORATION, AND MATHEMATICAL MODELING
Abstract
This study focuses on the restoration of large-module gear teeth of ball mills using the electroslag welding method, with an emphasis on practical results and mathematical modeling. The research established that optimal electroslag welding conditions are achieved by stabilizing key process parameters, such as current strength, slag bath volt-age, and cooling water flow rate. For high-quality welding of gear teeth with a module of 20 mm, the following parameters are recommended: current strength I=362.5 A, slag bath voltage U=73.25–74 V, and water flow rate Qw=3–3.5 l/min. These parameters ensure minimal roughness and the required hardness of the welded teeth. Mathematical modeling provided equations linking welding modes with the roughness and hardness of the welded teeth. The presented experimental data are highly relevant for the scientific com-munity and enterprises involved in the restoration of large-module gear wheels. The results hold significant practical value as they enable enterprises to reduce restoration costs and enhance the durability of components.
Highlights
- Optimal electroslag welding of gear teeth is achieved by stabilizing current, voltage, and water flow.
- Recommended welding mode (I = 362.5 A, U = 73.25–74 V, Qw = 3–3.5 l/min) ensures high-quality surfacing.
- Mathematical modeling establishes links between welding parameters and tooth roughness and hardness.
- Stable electroslag welding conditions reduce defects and increase durability of restored large-module gear teeth.
Keywords
Content
1 Introduction
Ball Drum Mills (BDM) (Fig. 1) are widely used for grinding coal and other materials in pulverizing systems of thermal power plants.
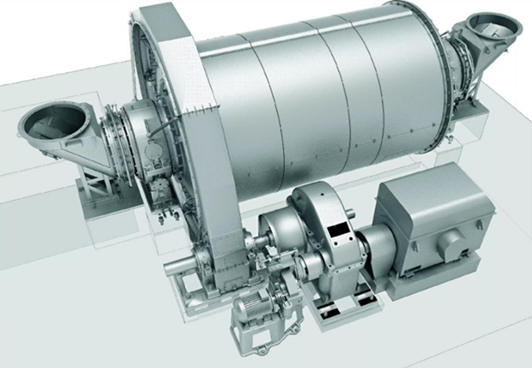
Fig. 1. Ball drum mills (scale 1:1000) [1]
However, the wear [2] of gear wheels, especially the drive pinion (Fig. 2), leads to significant economic and technical challenges [3], including disruption of component interactions, increased vibrations, and the possibility of sudden failures [4]. As a result of wear, tooth abrasion and breakage occur, and the initial dimensions (Fig. 3a) and shapes (Fig. 3b) are altered.
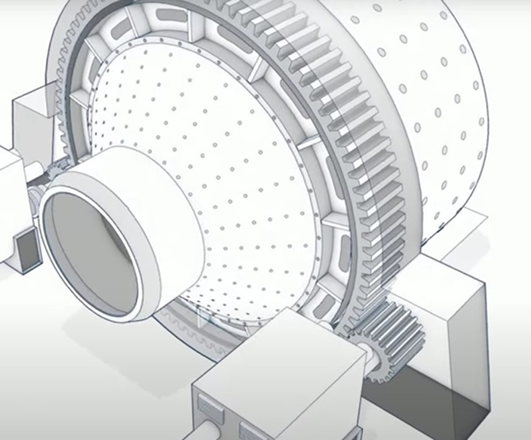
Fig. 2. Ball drum mill drive (scale 1:1000) [1]
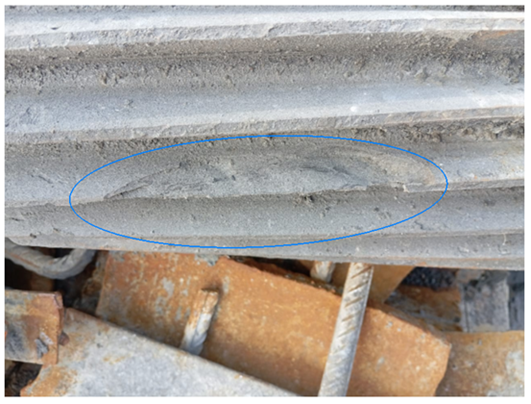
a) changing the shape of the teeth
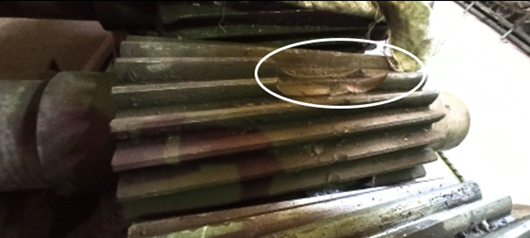
b) broken teeth of the gear wheel
Fig.3. Types of wear on the gear teeth of a ball drum mill
Existing methods for tooth restoration [5] include machining, welding [6], and other approaches [7]. Despite their application, the insufficient study of the influence of electroslag welding modes on the quality of the deposited layer and the mechanical properties of teeth hinders the development of optimal restoration methods, particularly for large-module gear wheels.
In this study, a comprehensive analysis of the influence of electroslag welding parameters on the quality of large-module gear teeth is presented, integrating experimental investigation, thermal considerations and statistical modeling.
2 Materials and methods
2.1 Experimental setup and materials
Laboratory installation for electro-slag surfacing (Fig.4) consists of welding tractor ADF-1005 Ural, crystallizer (4) with connections (7 and 8), and water meter for water consumption control. Electroslag surfacing begins with the supply of electric current from the power source 6, after which the necessary parameters of the operating mode are set from the control panel (1). The welding wire (3) with a diameter of 3 mm of grade Sv08G2S, fed from the cassette, passes through the mouthpiece. The mouthpiece is used when the volume of deposited metal exceeds 10 mm³ [8]. The material of the mouthpiece was selected depending on the material of the restored gear, with a diameter of 6 mm, and AISI 304 was used. The gap between the fusion zone and the center of the welding wire is 25mm. The crystallizer (4) is fixed using a special clamp. In the working area of the crystallizer from a container (5) is fed flux OX Flux 10.71 to ensure the cladding process. After preparing the device, the melting process is started by pressing the “Start” button on the control panel. Technical characteristics of the welding tractor are given in Table 1. OK Flux 10.71 belongs to neutral aluminosilicate fluxes of the CaO–Al₂O₃–SiO₂ system, providing the required electrical conductivity of the slag pool and a stable thermal regime during electroslag surfacing. Its composition promotes the formation of a homogeneous deposited metal, ensures efficient slag detachability and significantly improves wettability during the restoration of alloyed steels.
In the electroslag surfacing process, a shaped crystallizer [9] was used to form the restored tooth profile. The design incorporates a working cavity that reproduces the involute geometry of the gear tooth and a forced water-cooling system with inlet and outlet channels that stabilize the temperature during deposition.
The surfacing current strength was determined based on the technical specifications of the ADF-1005 'Ural' welding machine. The current values were set depending on the module of the surfaced tooth and the length of the crystallizer. Optimal current values were established experimentally. The current strength was controlled via the welding machine's control panel, where the required parameters were set, and during the experiment, the values were monitored visually.
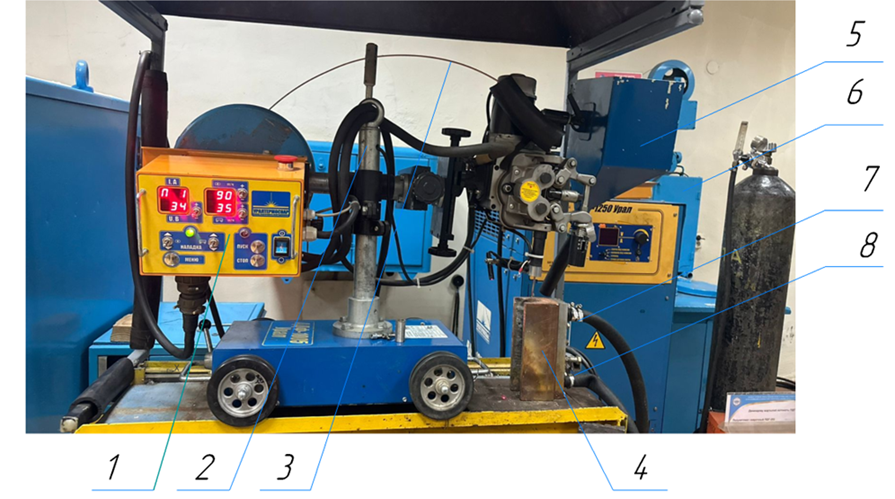
Fig. 4. Laboratory installation for electro-slag surfacing of large-module tooth samples: 1 - control panel, 2 - bracket for height adjustment, 3 - surfacing wire, 4 – crystallizer, 5 - flux container, 6 - power source, 7 - connector for water hose connection, 8 - connector for water supply
Table 1. Characteristics of welding tractor ADF -1005Ural
|
Numerical data |
|
|
Power supply voltage, V |
380 |
|
Maximum welding current, A |
1000 |
|
Frequency, Hz |
50/60 |
|
Welding current adjustment range, A |
200 – 1000 |
|
Number of welding heads |
1 |
|
PV at max current, % |
100 |
|
Welding speed, m/min |
0.3 - 1.0 |
|
Wire diameter, mm |
3.0 - 5.0 |
|
Spool weight, kg |
20 |
|
Tractor supply voltage, V |
110 |
|
Welding head tilt, ° |
±45 |
|
Tractor weight, kg |
54 |
|
Wire feed speed, m/min |
0.3 - 2.5 |
2.2 Control and monitoring of process parameters
2.2.1 Welding current control
The Current Strength was determined based on the technical specifications of the welding machine. The current values were set depending on the module of the welded tooth and the length of the mold. Optimal current values were established experimentally. Current control was carried out through the control panel of the welding machine, where the required parameters were set, and during the experiment, monitoring was performed visually (Table 2).
Table 2. Technical specifications of the welding machine ADF-1005 "Ural"
|
Welding machine ADF-1005 "Ural" |
|
|
Range |
350–400 A |
|
Control |
Visual. Every 2–3 minutes via digital display. |
|
Measurement Accuracy |
±5 A. |
2.2.2 Slag bath voltage evaluation
Slag bath stress is a determining factor in electro-slag surfacing, affecting both the stability of the process and the amount of penetration of the base metal. The voltage was not measured directly but was determined using a calculation method based on the current strength and system characteristics [10]:
|
\[U_{(\text{ш.в.})}=\frac{1000\left(16\sqrt{m}-45\right)}{I}\] |
(1) |
Where m - module of the cladding tooth, mm.
I - current intensity, A.
2.2.3 Control of water flow for mold cooling
In the electro-slag surfacing process, the crystallizer is used to form the clad metal by the specified shape. The greatest importance for ensuring the stability of the electro-slag process and the high quality of the welded and base metal joint is a stabilization of slag bath temperature. For this purpose, it is necessary that the amount of heat released in the slag bath and given off by it is equal (Fig.5). Violation of the balance of heat supply and consumption can lead to overcooling of the slag bath and its boiling, which sharply reduces the amount of heat used for the melting of electrode and base metals.
To control the cooling water flow rate in the experiment we used a water meter “Proteus-15C”, with a division value of 0.001m³, installed in the sanitary room of the laboratory, (Table 3).
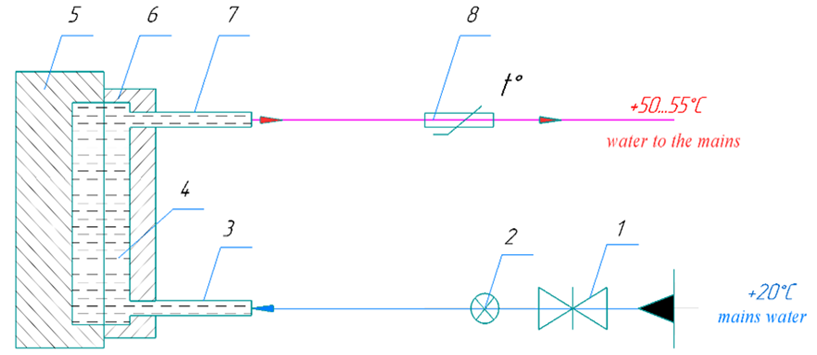
Fig. 5. Crystallizer cooling diagram: 1 – valve, 2 – water meter, 3, 7 – hose connection fittings, 4 – cooling channels in the cover and crystallizer, 5 – crystallizer, 6 – cover, 8 – water temperature control sensor
Table 3. Technical data and supply scheme of “Proteus-15C”
|
Equipment |
Water meter “Proteus-15C” |
|
Graduation value, m³ |
0,001 |
|
Measurement range, l/min |
2,5 - 4,5 |
|
Supply scheme |
Water was supplied through hoses from the meter to the mold, ensuring uniform cooling of the slag bath. |
To ensure water supply to the crystallizer from the meter, hoses were connected: one for water supply and the second for drainage. This scheme allowed effective regulation of the cooling-water amount. Direct temperature measurement inside the slag pool is technically impossible due to the extremely fluid and high-temperature molten slag. Therefore, the thermal regime was monitored indirectly by regulating and measuring the cooling-water flow, which ensured the stability of the slag bath during electroslag surfacing. During the experiment, the meter readings were stable, which contributed to uniform cooling and a stable overlay process.
2.3 Measurement methods
Surface Roughness plays a key role in ensuring the functionality [11], durability [12], and quality of gear transmissions [13]. It not only affects performance characteristics (e.g., contact fatigue and friction) [14] but is also associated with the presence of defects that arise during the welding process. Controlling surface roughness allows for:
- Reducing the Risk of Defects: High roughness often indicates issues in the welding process, such as incomplete fusion or slag inclusions. Managing welding parameters helps minimize the likelihood of these defects.
- Ensuring Even Material Distribution: This is critical for preparing the surface for machining, reducing the volume of material to be removed, and improving productivity.
- Reducing Processing Costs: Minimizing the layer for mechanical finishing lowers material and time costs and reduces wear on cutting tools.
Thus, studying and managing surface roughness during the welding stage is an essential part of the overall approach to ensuring the quality of restored gear wheels.
According to [15] surface roughness is evaluated by one of the following parameters: Ra - arithmetic mean deviation of the profile; Rz – the height of irregularities of the profile at ten points; Rmah - the highest height of the profile. This study considers the arithmetic mean deviation of the profile - Ra. The length of the section used to assess roughness is called the base length, it was taken for the dividing diameter within 0.8mm, and for the top of the tooth - 8mm by the roughness of the working drawing of the gear [16].
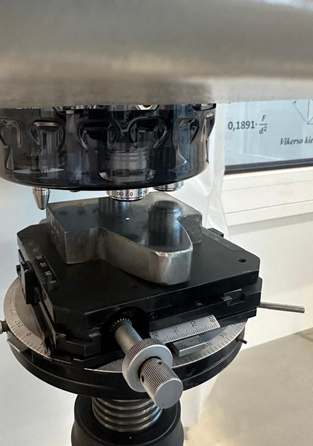
Determination of roughness parameters was carried out in a portable meter TR 220 (Fig. 6), the measuring range of the sensor needle was ±80 microns, and visually by comparing the surface with roughness standards. The meter calculates roughness parameters and displays all measured parameters on the LCD screen. The surface roughness was evaluated in the direction that gives the highest roughness after EAF, namely in the direction of the slagging process. When evaluating the surface roughness of the teeth surface, both longitudinal (along the tooth) and transverse (along the tooth height) directions were measured (Fig.7). For reliable roughness evaluation taking into account the registration of the device readings, the roughness parameters were determined at the base areas and the arithmetic mean value was taken as the measurement result.
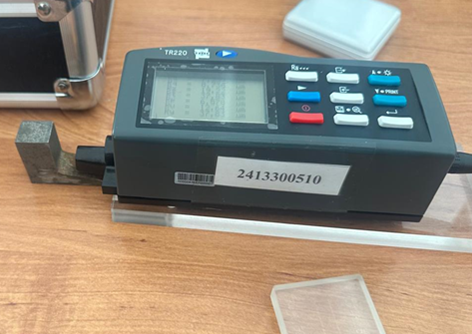
Fig. 6. Tooth sample roughness measurement process
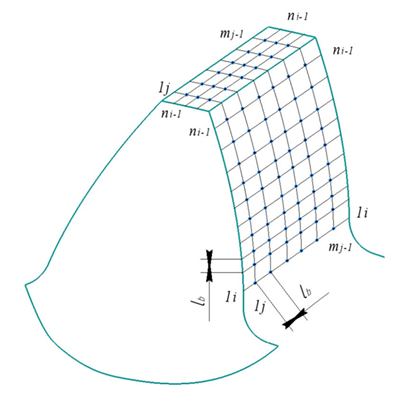
Fig. 7. Schematic of tooth surface roughness measurement; i - longitudinal direction of tooth, j - transverse direction of tooth profile
2.3.1 Determination of tooth surface hardness
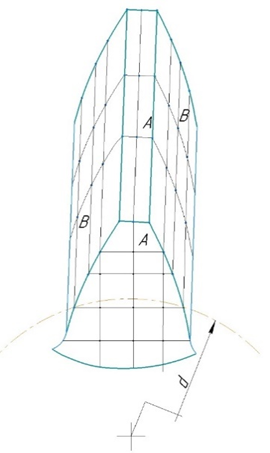
Hardness was measured by the Rockwell method at +20 °C (Fig. 8) using a Mitutoyo HV-100 hardness tester with a diamond indenter at a depth of 0.2 mm [17]. In the course of hardness measurement, measurements were made both on the working surfaces of the tooth and in its middle part. Within the framework of mathematical planning, the hardness values of the working surfaces of the tooth (B) were taken into account, and the hardness of the top and middle part (A) served as an indicator for controlling the stability of the surfacing process (Fig. 9).
2.4 Design of experiment and mathematical modeling
The qualitative parameters of the clad tooth are affected to a greater or lesser extent by a large number of factors in the surfacing process. According to the methodology given in, a combined square for a three-factor complex was constructed. The intervals of variation of the factors were chosen by experiments in such a way that monotonic changes in the studied indicators of the quality of the clad tooth surface were obtained within these limits. The design of the three-factor experiment at five levels is shown in Table 4.
The need for a method of rational planning of experiments arises when one has to deal with a large number of influencing factors since it is almost impossible to test all possible combinations of these factors on experience due to the huge number of such combinations [18].
Table 4. Three-factor experiment plan
|
|
Numbers |
||||
|
X1 |
X2 |
X3 |
|||
|
No. of tests |
Limits from to |
350 |
76 |
2,5 |
|
|
400 |
66,4 |
4,5 |
|||
|
Level 1 values 2 3 4 5 |
350 362,5 375 387,5 400 |
76 73,25 70,8 68,5 66,4 |
2,5 3 3,5 4 4,5 |
||
|
Function numbers |
Argument values in experiments |
||||
|
Y1 |
Y2 |
||||
|
1 |
10 |
26,2 |
350 |
76 |
2,5 |
|
2 |
9,2 |
27,7 |
350 |
76 |
3,5 |
|
3 |
7,9 |
26 |
350 |
76 |
3 |
|
4 |
9 |
29 |
350 |
76 |
4,5 |
|
5 |
8,6 |
28,7 |
350 |
76 |
4 |
|
6 |
9,2 |
30,6 |
362,5 |
73,25 |
2,5 |
|
7 |
7,9 |
34,8 |
362,5 |
73,25 |
3,5 |
|
8 |
7,5 |
32 |
362,5 |
73,25 |
3 |
|
9 |
11,4 |
31,6 |
362,5 |
73,25 |
4,5 |
|
10 |
11,1 |
33,4 |
362,5 |
73,25 |
4 |
|
11 |
11,6 |
33 |
375 |
70,8 |
2,5 |
|
12 |
12 |
31,3 |
375 |
70,8 |
3,5 |
|
13 |
11,8 |
33,8 |
375 |
70,8 |
3 |
|
14 |
13 |
35 |
375 |
70,8 |
4,5 |
|
15 |
12,8 |
35,7 |
375 |
70,8 |
4 |
|
16 |
13,1 |
32,78 |
387,5 |
68,5 |
2,5 |
|
17 |
13,8 |
30,78 |
387,5 |
68,5 |
3,5 |
|
18 |
13,5 |
30,9 |
387,5 |
68,5 |
3 |
|
19 |
14,1 |
29,2 |
387,5 |
68,5 |
4,5 |
|
20 |
14 |
30,1 |
387,5 |
68,5 |
4 |
|
21 |
14,3 |
25,7 |
400 |
66,4 |
2,5 |
|
22 |
15,1 |
25 |
400 |
66,4 |
3,5 |
|
23 |
14,9 |
25,3 |
400 |
66,4 |
3 |
|
24 |
15,7 |
24,6 |
400 |
66,4 |
4,5 |
|
25 |
15,5 |
24,98 |
400 |
66,4 |
4 |
The variable factors are X1 - current strength, A; X2 - slag bath voltage, V; X3 - water flow rate, l/min. The following parameters of the clad coarse-modular tooth were investigated:
- Y1 – the roughness of the clad tooth Ra, microns;
- Y2 - hardness of the tooth according to Rockwell HRC.
Based on the experiments conducted with the modes given in the plan, the following specimens of 30HGSA steel were obtained (Fig. 10).
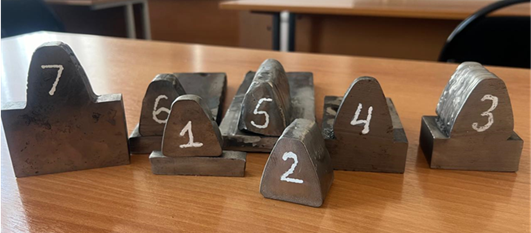
Fig. 10. Clad tooth samples
All samples, with a modulus of 20 mm were made of 30HGSA steel and obtained under different cladding modes as specified. The most typical results from 25 experiments are presented:
· No. 1,2 samples (I= 350 - 362,5 A; U = 76 V; 73,25 V; Qw = 2,5 and 3 l/min);
· No. 3 sample (modes I = 362,5 - 375 A; U = 70 V; 68,5 V; Qw = 3,5 l/min);
· No. 4 sample (modes I = 400 A; U = 66,4 V; 68,5 V; Qw = 2,5 l/min);
· No. 5, 6 samples (modes I = 387,5-400 A; U= 68,5-66,4 V; Qw = 3,5 - 4,5 l/min);
· No. 7 sample (modes I = 362,5-375 A; U = 70,8-73,25 V; Qw = 3 - 3,5 l/min).
3 Results and discussion
The results of the multivariate experiment were processed using the ANETR-5 software. The program implements standard statistical procedures for multifactor experimental design, including regression fitting, calculation of the Fisher criterion, Student’s t-test and residual variance analysis, which together ensure statistically reliable model construction and evaluation. The method is universal both in terms of application area and in the variants of model construction: models can take the form of sums, products of partial dependencies or their combinations, with consistent neutralization of the influence of those arguments that would traditionally be excluded from the analysis as statistically insignificant according to the Fisher criterion.
The method is deterministic, i.e. it allows to limit the choice of the model by known data on the theory of the process (type of equation, limits, etc.). at the output, the program, besides the analytical character of the partial relations, gives their graphs, and reliability estimation, ranks the factors by the strength of interaction on the results, and allows to single out significantly influencing factors [19].
We evaluate the degree of adequacy of the found models to the initial data through RMS:
|
\[\mathrm{RMS}\% = 100 \, \frac{\sqrt{\dfrac{\sum\limits (Y_E - Y_r)^2}{N-1}}} {\sqrt{\dfrac{\sum\limits \left(Y_E - \overline{Y_E}\right)^2}{N-1}}} \] |
(2) |
where Үe – an experimental value of the function (quality parameter of the clad tooth);
Үr - calculated value of the function;
$\overline{Y_E}$ - average value of the function;
N - number of experiments.
At each stage, in addition to the RMS between the initial data and the calculated data, the multiple correlation coefficient R and Fisher's criterion F are calculated [20].
According to the literature, the model is considered excellent if the RMS is less than 20% and good if the RMSD is between 20% and 50%.
Taking into account the types of generalized equations and equation coefficients, we obtain the following dependencies linking the modes of surfacing parameters with the quality of the clad tooth:
1. Y1 – the roughness of the clad tooth Ra, µm
|
$Y_1 (X_1,X_2,X_3 )=2,459⋅10^(-2)⋅e^(0.124⋅X_1 )+0,492⋅X_2-1,937⋅10^(-4)⋅X_3^2+0,145⋅X_3-28,47$ |
(3) |
RMSD = 35.68%. Multiple correlation coefficient: R=0.924.
The calculated Fisher's criterion F = 7.82749 is obtained greater than that for 1% significance level F (001) = 2.63605 and for 5% F (005) = 1.97744.
2. Y2 – hardness of the tooth according to Rockwell HRC.
|
$Y_2 (X_1,X_2,X_3 )=-18227.4/X_1 +0,688⋅X_3-3,273⋅10^(-2)⋅X_2^2+3,126⋅X_2+6,53$ |
(4) |
RMSD % = 34.34%. Multiple correlation coefficient: R=0.903.
The calculated Fisher's criterion F=8.47896 is greater than for 1% significance level F (001) =2.63605 and for 5% significance level F (005) = 1.97744
The obtained mathematical models, linking the quality of the clad tooth with cladding modes, allow for control of the quality parameters of the clad tooth, providing high parameters and operational properties of the gear.
3.1 Statistical reliability and measurement uncertainty analysis
To evaluate the reliability of the obtained experimental data, measurement uncertainty was assessed based on the accuracy of the TR220 roughness tester and the Wilson VH1150 hardness tester. Standard deviation, coefficient of variation and confidence intervals were calculated for each experimental point.
A residual analysis was conducted to verify the adequacy of the regression model. The residual plot for hardness (Fig. 11) shows a random distribution without visible patterns, indicating the absence of systematic errors. The histogram of residuals for Ra (Fig. 12) demonstrates an approximately normal distribution, which confirms that the assumptions of normality and independence are satisfied.
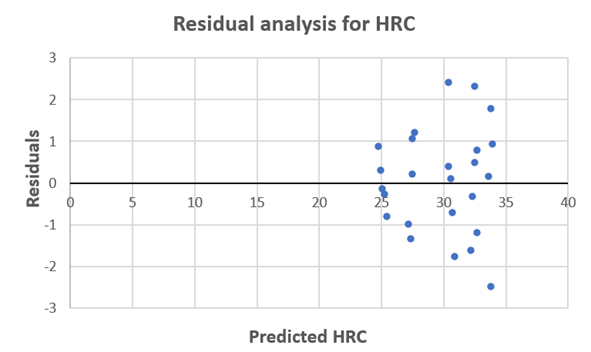
Fig. 11. Residual plot for hardness (HRC)
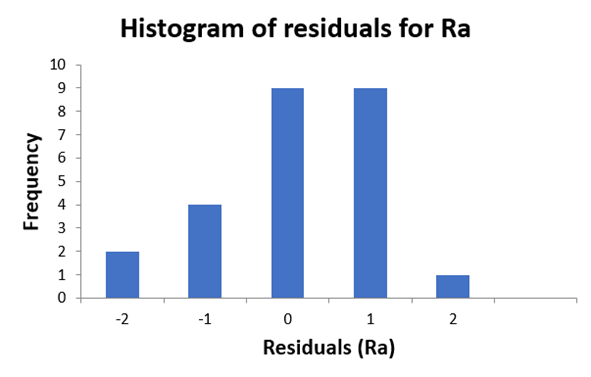
Fig. 12. Histogram of residuals for surface roughness (Ra)
3.2 Model quality assessment
A series of experiments was conducted to validate the proposed mathematical model. Experimental data obtained under various welding conditions (current strength, slag bath voltage, coolant flow rate) were compared with the calculated values for surface roughness (Ra) and hardness (HRC). The root mean square deviation (RMSD) between the experimental and calculated data was 35.68% for Ra and 34.34% for HRC. High multiple correlation coefficients (R = 0.924 for Ra and R = 0.903 for HRC) demonstrate good agreement between the model predictions and the experimental data. The Fisher criterion confirms the statistical significance and adequacy of the model, as the calculated F values exceed the critical levels for the 1% and 5% significance thresholds.
The electroslag surfacing process is characterized by strong non-linearity, high thermal gradients and metallurgical variability, which inherently increase the dispersion of experimental results. Under such conditions, RMSD values in the range of 30–35% remain acceptable for representing general process behavior [21]. The statistical diagnostics performed — including the analysis of residuals and the assessment of distribution shape — further support the adequacy and reliability of the obtained model.
3.3 Comparison with existing models
An analysis of the literature [22, 23] revealed that existing studies on gear tooth restoration using various methods are primarily focused on general aspects of restoration and metal welding, such as strength limits, microstructure analysis, and the combined effects of residual stress and hardness gradient on the contact fatigue properties of tooth surfaces. However, no specialized studies were found that focus on modeling and controlling the welding processes of large-module teeth, especially with regard to controlling the roughness (Ra) and hardness (HRC) parameters of the welded metal.
3.4 Convergence of results with changing initial conditions
To test the stability of the proposed model, calculations were performed under various initial conditions, such as changes in current strength, slag bath voltage, and coolant flow rate. The results showed that the model remains adequate and demonstrates stable convergence when the initial parameters vary within ranges typical of standard welding modes. The maximum deviation of calculated values from experimental ones under changing conditions was no more than 5-10%, indicating the high reliability of the model for controlling the welding process.
We reveal regularities and dependencies between roughness parameters (Fig. 13) and the hardness of the clad tooth from the cladding mode (Fig. 14).
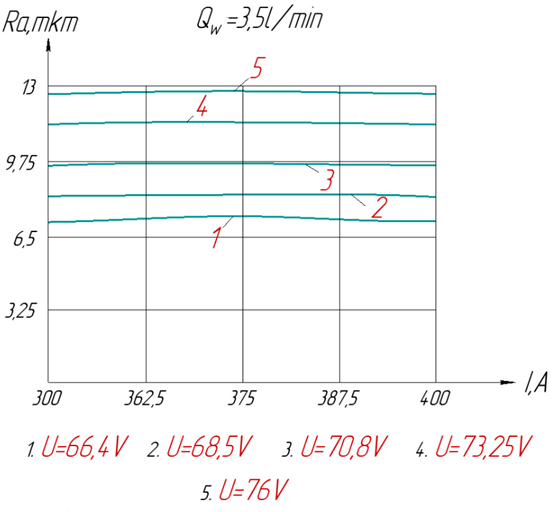
Fig. 13. Graph of voltage and current change at water flow rate Qw = 3.5 l/min.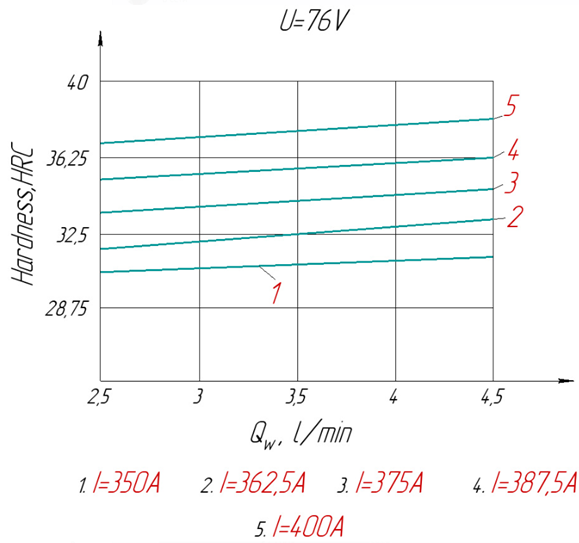
Fig. 14. Graph of change of current value at slag bath voltage U=76V
In electro-slag surfacing (Fig.15), a perfectly smooth surfacing surface cannot be obtained; it is more similar to the surface of a casting (Fig.16). In improving the tooth surfacing technology, the authors aimed to achieve minimal surface roughness.
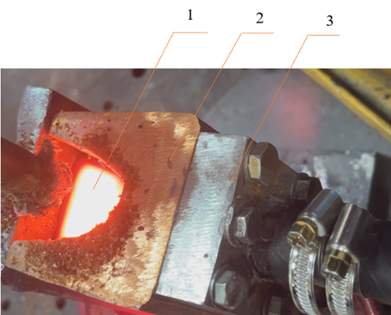
Fig. 15. Tooth surfacing process: 1 - fused tooth, 2 – crystallizer, 3 - cooled cover
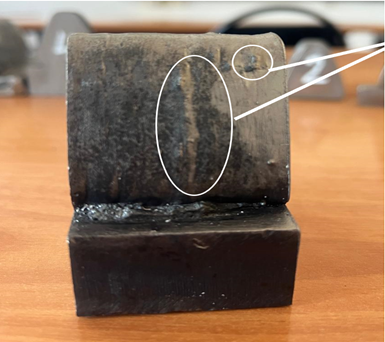
Fig. 16. Roughnesses on the surface of the clad tooth at regimes I= 362.5 - 375 A; U= 70 - 68.5 V; Qw=3.5 l/min
During electro-slag surfacing, heat is generated intensively. The water in the cooling system helps to dissipate this heat. If the water flow rate is reduced to optimum levels, cooling is sufficiently fast to reduce the chance of rough surface finishes. However, if the flow rate is reduced too much (less than 3 l/min), the cooling is insufficient to maintain a stable temperature in the surfacing zone, resulting in overheating and poor surface finish. When the metal is overheated due to insufficient cooling, the microstructure of the cladding layer changes. In this undesirable structural changes such as grain enlargement, pore formation, and cracking are observed. This can also deteriorate the surface properties and its roughness. During experimental studies, it was observed that every time the crystallizer cooling is increased up to 4.5 l/min it leads to a rough surface defect in the form of ducking or corrugation (Fig.17).
Increasing the welding current (up to 400A) leads to an increase in the roughness height and hardness in the middle part of the clad tooth (4 samples).
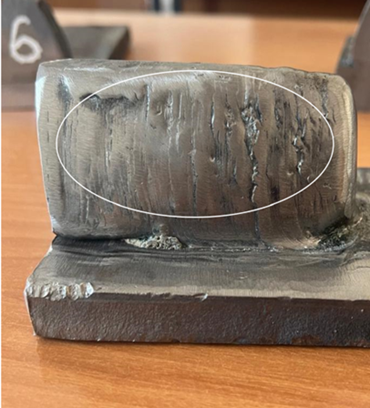
Fig. 17. Defects in the form of corrugation on the tooth surface at the mode: I= 387.5-400 A;U= 68.5-66.4 V; Qw =3.5-4.5 l/min
With increasing slag bath voltage, a decrease in roughness parameters is observed (Fig. 13). This phenomenon is related to the fact that increasing slag bath temperature leads to thinning of garnish crust and improvement of its forming properties. The pitch and height of roughnesses decrease as the water flow rate decreases (3 - 3.5 l/min). The change in water flow rate in the cooling system is related to heat generation and cooling of the clad metal. At insufficient cooling in the maximum current value, the material undergoes additional thermal deformations. Inhomogeneous shrinkage (#1, 2, 3, 5) and thermal stress arise, which leads to the formation of irregularities and deterioration of surface characteristics (Fig.16).
4 Conclusions
The optimal surfacing mode is characterized by complete process stability, eliminating short-term disruptions. This is achieved by stabilizing electrical and technological parameters (current strength, slag bath voltage) and processing a significant amount of experimental data. As a result, high-quality surfacing of the gear tooth is ensured, with a surface roughness of Ra 7.5-9 μm and hardness of 34-36 HRC. The following surfacing parameters are recommended:
1. Current strength, I = 362.5 A.
2. Slag bath voltage, U = 73.25-74 V.
3. Water flow rate, Qw = 3-3.5 l/min.
As a result of the conducted research, it has been established those optimal modes of electroslag surfacing are achieved by stabilizing key process parameters (current strength, slag bath voltage, and water flow rate). These parameters ensure high-quality surfacing of gear teeth with minimal surface roughness and the required hardness.
It was revealed that the stabilization of electrical and technological parameters, such as current strength and slag bath voltage, allows for the elimination of short-term process interruptions. This, in turn, contributes to the formation of a smoother and more stable surface with a roughness of Ra 7,5-9 μm, meeting high surface quality standards for gear teeth.
The established surfacing modes (I = 362.5 A; U = 73.25-74 V; Qw = 3-3.5 l/min) ensure not only optimal heat dissipation and uniform cooling but also help prevent overheating and structural defects such as pores, cracks, and grain enlargement, which could negatively affect the wear resistance and durability of the teeth.
It was experimentally confirmed that increasing the current strength to 400 A and above leads to increased thermal deformations and surface defects such as wrinkling and shrinkage. This highlights the importance of maintaining current strength within the range of 362.5-375 A to ensure a high-quality result.
References
- https://library.e.abb.com/public/25ce82cc89a14c85a862dd840abcdff8/Ring_geared_mill_drives_LR_web.pdf, accessed on 24.02.2024.
- Y.Huangfu,X.Dong, K.Chen, Zh.Peng. Coupling mechanism between systematic elastic deformation and gear surface damage. International Journal of Mechanical Sciences, Vol. 238, 2023, 107850. https://doi.org/10.1016/j.ijmecsci.2022.107850.
- J.C. Poletto, C.G. Fernandes, L.Y. Barros, P.D. Neis, K. Pondicherry, D. Fauconnier, O. Seabra, P. De Baets, N.F. Ferreira. Identification of gear wear damage using topography analysis. Wear, Vol.522, 2023, 204837. https://doi.org/10.1016/j.wear.2023.204837.
- V.G. Sfakiotakis, D.E. Katsareas, N.K. Anifantis. Boundary element analysis of gear teeth fracture. Engineering Analysis with Boundary Elements, Vol. 20, Issue 2, 1997, P.169-175. https://doi.org/10.1016/S0955-7997(97)00062-3.
- W. Wang, J. Zhao, R. Zhai. A forming technology of spur gear by warm extrusion and the defects control. Journal of Manufacturing Processes. Vol. 21, 2016, pp. 30-38. https://doi.org/10.1016/j.jmapro.2015.10.001.
- S. Lj, T. Lazovic. Technological heredity – A decisive factor for tribological features of regenerated gears. Engineering Failure Analysis. Vol.42, 2014, pp. 121-132. https://doi.org/10.1016/j.engfailanal.2014.04.004.
- M. Miladinov, S. Sedmak, B. Djordjevic, A. Sedmak,F.Vucetic, A. Milivojevi. Repairing of cracks on tooth gear ring of a bucket-wheel excavator. Procedia Structural Integrity, Vol. 48, 2023, P. 27-32. https://doi.org/10.1016/j.prostr.2023.07.106.
- Vullo, V. (2020). Tooth bending strength of spur and helical gears. In: Gears. Springer Series in Solid and Structural Mechanics, Vol. 11. Springer, Cham. https://doi.org/10.1007/978-3-030-38632-0_3
- Buzauova T.M., Smailova B.K., Bartenev I.A. Kristallizator dlya elektroslakovoy naplavki krupnomodul'nykh zub'ev. Patent na poleznuyu model' No. 9186. 31.05.2024.
- Patent No. 1149518A. "Method for Restoring Large-Module Gear Teeth." V.A. Danilov, V.I. Bochenin, A.N. Davidovsky, I.A. Bartenev. 2004.
- W. Yuqin, Zh. Wei, T Jinyuan. Research on the correlation between roughness parameters and contact stress on tooth surfaces and its dominant characteristics. Measurement, Vol. 238, 2024, 115399. https://doi.org/10.1016/j.measurement.2024.115399.
- H. Ding, Sh. Rong, X. Zhang, K. Li, K. Rong, Zh. Zhou. Roughness tooth surface loaded contact pressure forecasting model for face-hobbed hypoid gears. Advanced Engineering Informatics, Vol. 60, 2024, 102399. https://doi.org/10.1016/j.aei.2024.102399.
- A.Pawar, V. Manne, A. Vacca, M. Rigosi. Analysis of torque efficiency of External Gear Machines considering gear teeth roughness. Mechanism and Machine Theory, Vol. 199, 2024, 105675. https://doi.org/10.1016/j.mechmachtheory.2024.105675
- W. Yuqin, Zh. Wei,T. Jinyuan. Research on the correlation between roughness parameters and contact stress on tooth surfaces and its dominant characteristics. Measurement, Vol. 238, 2024, 115399. https://doi.org/10.1016/j.measurement. 2024.115399.
- GOST 2789-73 (ST SEV 638-77). Surface Roughness. Parameters and Characteristics. Moscow: Standards Publishing, 2024, 10 pp.
- Method for Measuring Surface Roughness Parameters According to GOST 2789-73. Using Profile Method Instruments MI41-75. Moscow: Standards Publishing, 2015, 15 pp.
- GOST 9013-59 (ISO 6508-86) Metals. Rockwell Hardness Test Method. Moscow: Standards Publishing, 2001, 10 pp.
- J.K. Kalita, D.K. Bhattacharyya, S. Roy. 1–Introduction. Fundamentals of Data Science.Theory and Practice. 2024, Pages 1-13. https://doi.org/10.1016/B978-0-32-391778-0.00008-9.
- D. Huang, F. Wu, Y. Zhao, Jun Yan, H. Zhang. Application of high-credible statistical results calculation scheme based on least squares Quasi-Monte Carlo method in multimodal stochastic problems. Computer Methods in Applied Mechanics and Engineering, Vol. 418, Part B, 5, 2024, 116576. https://doi.org/10.1016/j.cma.2023.116576.
- Z. Song, A. Mukherjee, P. Qiu, M. Zhou. Two robust multivariate exponentially weighted moving average charts to facilitate distinctive product quality features assessment. Computers & Industrial Engineering, Vol.183, 2023, 109469. https://doi.org/10.1016/j.cie.2023.109469.
- Ryabtsev I., Fomichov S., et al., Surfacing and Additive Technologies in Welded Fabrication, Springer, 2023.
- https://doi.org/10.1007/978-3-031-34390-2
- L. Zhu, Sh. Wang, H. Pan, C. Yuan, X. Chen. Research on remanufacturing strategy for 45 steel gear using H13 steel powder based on laser cladding technology. Journal of Manufacturing Processes, Vol., 2020, pp. 344-354. https://doi.org/10.1016/j.jmapro.2019.12.009.
- S. Kumar, R. Singh. Investigation of tensile properties of shielded metal arc weldments of AISI 1018 mild steel with preheating process. Materialstoday: proceebings. Vol. 26, Part 2, 2020, pp. 209-222.
Conflict of Interest Statement
The authors declare that there are no conflicts of interest regarding the publication of this paper. The research was conducted independently, with no financial or personal relationships with other people or organizations that could have influenced the work reported in this paper.
Author Contributions
Data Availability Statement
No dataset is associated with this study.
Supplementary Materials
There are no supplementary materials.