Original Scientific Paper, Volume 23, Number 2, Year 2025, No 1269, pp 243-252
Received: Oct 09, 2024 Accepted: Apr 07, 2025 Published: Jun 16, 2025
DOI: 10.5937/jaes0-54018
IDENTIFYING RELEVANT SUSTAINABILITY COMPONENTS FOR LOCAL ROAD PAVEMENT
Abstract
To ensure our sustainable future, the whole lifecycle of our current and newly built infrastructure must satisfy sustainable standard, focusing Sustainable Development Goals (SDG) 13. It should meet functional requirements of reducing negative impacts to the environment while at the same time support economic growth and societal development. Due to its vast network, local roads may contribute to sustainable living assuming that it is designed, constructed, operated, and maintained in such a way that satisfy sustainable standard. Despite the fact that sustainable road rating systems have been developed in many countries, there is no agreement on the components for defining and measuring local road sustainability, especially in developing countries. In facilitating the development of the future local road sustainability index, this paper attempts to identify the components by finding insights and agreement from experts. In this case Delphi technique was employed. Seventeen components were specified consists of eleven environmental components, three economic components, and two social components. This means that the achievement of local roads sustainability integrates the three aspects; environmental stewardship, economic growth, and social development.
Highlights
- Identified seventeen sustainability components for local road through Delphi method.
- Integrated environmental, economic, and social aspects in sustainability assessment.
- Focused on aligning local road infrastructure with Sustainable Development Goals (SDG) 13.
Keywords
Content
1 Introduction
Sustainability has three main pillars namely people, planet, profit [1,2,3,4]. It reflects three dimensions: social, environmental, and economy. Sustainability can be seen as intersections of those three dimensions. Those three pillars, however, are quite abstract and open to interpretations. In order to measure road sustainability, attempts have been carried out to identify the specific components of those three pillars, also known as theme or category [4,5,3,4]. Further, an issue arises for measuring local road sustainability, what is and how to identify the specific and relevant components in measuring local road sustainability.
To ensure our sustainable future, we must design, construct, and operate sustainable infrastructure. Hence road networks must satisfy sustainable criteria. In order to assess its sustainability, many countries publish road rating system, in which road network must meet a certain threshold. However, there is no agreement on the indicators for assessing road sustainability within those systems.
To meet sustainability criteria based on highways sustainability rating system, therefore roadway must be designed, constructed, operated and maintained in compliance with sustainable principles and best practices [6]. Sustainability best practices need to be implemented for the hold roadway life cycle; design, construction, operation and maintenance, to end of life. Nonetheless, local road authority encounter difficulties in implementing the required criteria by the rating system due to the lack of guidelines for sustainability practices. This implies there is a need to develop sustainability criteria in the rating system to ensure the best practices and actions become clearer and applicable for local road authority in line with the project life cycle, to address the challenges of efficient use of natural resources and greenhouse gas emissions to achieve SDG 13 [7] .
Agreement on the definition and operationalization of urban environmental sustainability can be achieved using the Delphi which is a structured data collection method normally used to facilitate a group of experts to reach an agreement on a particular topic [8]. This method has been frequently used to develop definitions and operationalization of different concepts [9,10].
This paper discusses the sustainability components by defining the proper concepts and selecting appropriate indicators by means of Delphi method. In our on-going research these concept and indicators will be adopted for developing local road sustainability index.
2 Materials and methods
Various efforts have been made to define road sustainability components, however the current components are being used without agreement on which components are most relevant for defining and measuring the sustainability of local roads. This research is very important because conducted to identify the most relevant components to measure local road sustainability using the Delphi method.
The process invites a group of experts whom deal with local road design, construction, and maintenance, to provide their point of view of local road sustainability. Its findings are expected to serve as a platform for the development of local road sustainability rating system.
2.1 The Delphi Method
Delphi method is a systematic and interactive technique which involves the collection of knowledge from a panel of experts through a series of questionnaires interspersed with controlled feedback [11][12]. It was developed by Dalkey and Helmer in the 1950s. It consists of at least two rounds of data collection. The cycle of data collection and feedback will be terminated when a certain level of agreement has been reached or expert opinion has been established [13,11].
2.2 Expert respondent
Stakeholder analysis is a technique normally used to identify and select experts. These experts must have influence and interest (importance) as well as the capacity and competence to be selected as respondents [14]. The requirements to be fulfilled by the respondents in the Delphi technique include (1) having the knowledge and experience on pavement and local road management, (2) being willing to participate by providing opinions or input, (3) having sufficient time to participate, and (4) having effective communication skills [15].
The stakeholder analysis begins by identifying key stakeholders from various institutions or individuals who may influence or be affected by the local road management system. This can be accomplished by compiling a straightforward list and addressing questions such as: Who are the potential beneficiaries of this initiative? Who might experience negative impacts from this initiative? What are the interrelations among these stakeholders? The second step involves assessing the stakeholders' interests and the potential impacts of those interests. This is done by answering questions such as: What are the stakeholders' expectations concerning the local road project? What benefits or advantages could the stakeholders obtain? The third step involves evaluating the influence and interests of each stakeholder group. This assessment considers their authority and position (political, social, and economic), institutional or organizational level, control over strategic resources, informal influence, including personal relationships, power dynamics with other stakeholders, and significance in the success of the local road project. At this stage, two key aspects emerge: stakeholders with high influence and stakeholders with high importance. The final step is developing a stakeholder analysis framework using an Importance-Influence Matrix to identify expert respondents. Stakeholders with both high influence and high importance are designated as expert respondents.
The output of the analysis is two groups of expert respondents namely the government and the community groups. The government group consists of local road managers as well as experts from Indonesian research and development centers for roads and bridges. While the community group consist of lecturers and researchers. A total of 132 expert respondents fulfilled this requirement and they all participated in the first round and the round of the Delphi study.
2.3 Questionnaire development
The questionnaire for the first round of the Delphi study was developed based on several existing highways sustainability rating systems. The components and the corresponding components of these four highways sustainability rating systems were identified and put together in one list. Summary of four highways sustainability rating systems appears in Table 1.
Table 1. Summary of four highways sustainability rating systems
| System | Brief |
| GreenLITES [16] | Incorporating sustainable choices for evaluating projects |
| Greenroads [17] | Sustainability best choices should be satisfied and voluntary best practices to enhance sustainability |
| IN-VEST [18] | Consists on sustainability best choices to measure the sustainability of highways construction |
| I-LAST [19] | Consist of the rating system and the guide to evaluate the sustainability of highways projects |
The appropriate components of these road rating systems were integrated in the questionnaire that involves the construction implementation, pavement design, and maintenance phase. There are 10 sustainability components in the construction implementation phase, 14 sustainability components in the pavement design phase, and 4 sustainability components in the maintenance phase. List of sustainability components appears in Table 2. The questionnaire was pre-tested for validity and reliability using a cognitive interview approach and three expert respondents from each group [20].
Using a 5-point scale ranging from 'strongly disagree' to ‘strongly agree,' experts were asked to express their agreement or disagreement with two statements about their work concerning road sustainability. The experts were then shown the 28 components in random order. They were asked, "How relevant are the following elements for identifying the sustainability of local road networks, based on your expertise?" Experts could rate each indicator on a 5-point scale, with 1 being "not at all relevant" and 5 being "completely relevant”.
Subsequently, experts were asked to explain why they evaluated them as relevant for up to two components (they had rated with at least a 4). Additionally, experts were invited to suggest up to two relevant components they missed on the list of 28 components. The questionnaire was concluded with several background questions to verify whether experts were assigned to the correct institution type.
A questionnaire, similar to the previous one, was established for the second Delphi round. Then, experts were asked to assess the relevance of the 28 components for identifying local road sustainability. Each element was followed by a brief overview of the first round’s finding. This summary included a table with summary statistics showing the component’s median assessment, interquartile range, and the percentage of evaluations equal to or greater than 4. The summary also discussed in brief why experts assessed the components as relevant. Next, experts were asked to evaluate the significance of additional elements, which were added based on experts’ ideas in the first round.
Table 2. Summary of sustainability components from four highways sustainability rating systems
| Phase | Components | ID |
| Design | Life cycle cost analysis | D1 |
| Road safety planning | D2 | |
| Long-life pavement design | D3 | |
| Porous pavement design | D4 | |
| Warm asphalt mix planning | D5 | |
| Cold asphalt mix planning | D6 | |
| Quiet Pavement Planning | D7 | |
| Road Alignment Design | D8 | |
| Replace the median hardened | D9 | |
| Environmental management system | D10 | |
| Reduction hardened shoulder | D11 | |
| Replace the median hardened | D12 | |
| Water-permeable pavement | D13 | |
| Reuse and recycle materials | D14 | |
| Construction | Implementing a quality management system | C1 |
| Conducting environmental training | C2 | |
| Reducing the use of fossil fuels | C3 | |
| Reducing emissions of construction equipment | C4 | |
| Reducing emission on site | C5 | |
| Using recycled materials | C6 | |
| Using materials near the project site | C7 | |
| Waste management | C8 | |
| Maintaining drainage channels | C9 | |
| Constructing retaining wall to prevent soil sliding | C10 | |
| Maintenance | Pavement management system | M1 |
| Road infrastructure maintenance | M2 | |
| Control work zone traffic | M3 | |
| Road preservation | M4 |
The number of Delphi rounds is determined by the stability of the expert's answer and the difference in the correlation coefficient between the two Delphi rounds [21][22]. The Wilcoxon signed-ranks test tested the stability of the expert answers. If the stability of the expert's answer has been met, then no further Delphi round is needed.
2.4 Analytical procedure
The Mann-Whitney test was employed to examine the significant differences between opinions of group of experts. The output will determine how strong the agreement be-tween those two experts’ group. Moreover, the Wilcoxon signed-ranks test inspect the stability of the answer between two consecutive Delphi rounds. It was carried out by measuring difference value in the coefficient of variation (CV) between the 2 Delphi rounds. The significant level (p) in the Wilcoxon signed-ranks test that is greater than 0.05 (p>0.05) and the difference in CV values between the 2 Delphi rounds that is less than 0.2 or 20% (∆CV<0.2) indicates the achievement of stability and no further Delphi cycle are required. The measurement of the expert agreement was determined in this study by meeting the three combinations of values stated as follows: (1) interquartile range (IQR) ≤ 1 [12] [15] [23] [24]; (2) the percentage of agree and strongly agree answers ≥ 75% [21]; (3) standard deviation (SD) ≤ 1 [15]. Formula IQR, SD, and CV are presented in the following equation 1, 2 and 3.
| (1) | |
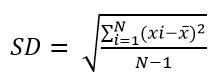 |
(2) |
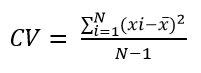 |
(3) |
where IQR = interquartile range, Q3 = the value between the median and the largest data, Q1= the value between the median and the smallest data, SD = standard deviation, CV = coefficient of variation, N= the size of the data, xi = each value from the data, and x ̅= mean.
3 Results and discussion
Statistical analysis was conducted for each component including mean, median, inter-quartile range (IQR), percentage of agree and strongly agree (% of answers 4-5), standard deviation (SD), coefficient of variation (CV), significant level (p) Mann-Whitney test, and significant level (p) Wilcoxon signed-rank test in the first and second rounds of the Delphi method.
3.1 The fist Delphi round
In the first round of Delphi, there was no significant difference in answers between government and community respondents (lecturers or researchers). This is evidenced by the results of the Mann-Whitney Test presented in Tables 3 and 4, where asymptotic significance p = 0.000, and Z = -0.315. Because the p value of 0.000 is less than 0.05 and because the statistical value of Z is -0.315 smaller than Z table 1.96 (two-way test with α= 5%), there is no significant difference in answers between government and community groups.
Table 3. Man-Whitney-ranks test result (Delphi I)
| Expert | N | Mean rank | Sum of ranks | |
| Agree | Government | 66 | 84.12 | 5552.0 |
| Community | 66 | 48.88 | 3226.0 | |
| Sum | 132 |
Table 4. Test Results Statistics on the Mann Whitney Test (Delphi I)
| Agree | |
| Mann-Whitney U | 1015.000 |
| Wilcoxon W | 3226.000 |
| Z | -0.315 |
| Asymptotic Significance (2-tailed) | 0.000 |
3.2 The second Delphi round
In the second round of Delphi, there was also no significant difference in answers between government and community respondents (lecturers or researchers). This was evidenced by the results of the Mann-Whitney Test presented in Tables 5 and 6, where asymptotic significance p = 0.000, and Z = -0.394. Because the p value of 0.000 is less than 0.05 and because the statistical value of Z is -0.394 smaller than Z table 1.96 (two-way test with α=5%), there is no significant difference in answers between government and community groups.
Table 5. Man-Whitney-ranks test result (Delphi II)
| Expert | N | Mean rank | Sum of ranks | |
| Agree | Government | 66 | 84.38 | 5569.0 |
| Community | 66 | 48.62 | 3209.0 | |
| Sum | 132 |
Table 6. Test Results Statistics on the Mann Whitney Test (Delphi II)
| Agree | |
| Mann-Whitney U | 998.000 |
| Wilcoxon W | 3209.000 |
| Z | -0.394 |
| Asymptotic Significance (2-tailed) | 0.000 |
Table 7. Test Statistics results on the Wilcoxon test
| Delphi2 – Delphi1 | |
| Z | -0.161 |
| Asymptotic Significance (2-tailed) | 0.872 |
3.3 Experts’ answer stability
The Wilcoxon test p-value of 0.872 > 0.05 was obtained and this means there was no difference in the response from the first and second rounds. Moreover, the statistical analysis showed that the difference in CV values between the rounds was in the range of 0.00-0.02 which is smaller than 0.2 or 20% and this also means there was stability [12]. These two analyses showed that the answers provided by the respondents were stable, therefore, there was no need for further Delphi rounds. The results of the Wilcoxon signed-ranks test are presented in Table 7, and the results of the coefficient of variance (CV) are presented in Table 8.
Table 8. Difference value in the Coefficient of Variation (CV) between the two Delphi round
| Components ID | CV-Delphi I | CV-Delphi 2 | ΔCV |
| Life cycle cost analysis (D1) | 0.22 | 0.21 | 0.01 |
| Road safety planning (D2) | 0.22 | 0.21 | 0.01 |
| Long-life pavement design (D3) | 0.09 | 0.11 | 0.01 |
| Porous pavement design (D4) | 0.31 | 0.31 | 0.00 |
| Warm asphalt mix planning (D5) | 0.21 | 0.23 | 0.02 |
| Cold asphalt mix planning (D6) | 0.24 | 0.26 | 0.02 |
| Quiet Pavement Planning (D7) | 0.25 | 0.24 | 0.01 |
| Road Alignment Design (D8) | 0.17 | 0.19 | 0.02 |
| Replace the median hardened (D9) | 0.23 | 0.23 | 0.00 |
| Environmental management system (D10) | 0.39 | 0.38 | 0.01 |
| Reduction hardened shoulder (D11) | 0.27 | 0.29 | 0.02 |
| Replace the median hardened (D12) | 0.22 | 0.21 | 0.01 |
| Water-permeable pavement (D13) | 0.16 | 0.18 | 0.02 |
| Reuse and recycle materials (D14) | 0.15 | 0.16 | 0.01 |
| Implementing a quality management system (C1) | 0.14 | 0.15 | 0.01 |
| Conducting environmental training (C2) | 0.16 | 0.16 | 0.00 |
| Reducing the use of fossil fuels (C3) | 0.22 | 0.21 | 0.01 |
| Reducing emissions of construction equipment (C4) | 0.21 | 0.21 | 0.00 |
| Reducing emission on site (C5) | 0.23 | 0.22 | 0.01 |
| Using recycled materials (C6) | 0.22 | 0.24 | 0.02 |
| Using materials near the project site (C7) | 0.26 | 0.27 | 0.01 |
| Waste management (C8) | 0.24 | 0.24 | 0.00 |
| Maintaining drainage channels (C9) | 0.19 | 0.18 | 0.01 |
| Constructing retaining wall to prevent soil sliding (10) | 0.17 | 0.18 | 0.01 |
| Pavement management system (M1) | 0.13 | 0.13 | 0.00 |
| Road infrastructure maintenance (M2) | 0.10 | 0.11 | 0.01 |
| Control work zone traffic (M3) | 0.16 | 0.16 | 0.00 |
| Road preservation (M4) | 0.21 | 0.21 | 0.00 |
3.4 Discussion
Table 9 shows the value of interquartile range (IQR), the percentage of ‘agree’ and ‘strongly agree’ (% agree), and standard deviation (SD) of each component.
There are seventeen sustainability components that meet these 3 combinations. They include (1) life cycle cost analysis, (2) road safety planning, (3) long life pavement design, (4) environmental management system, (5) water-permeable pavement, (6) reuse and recycle material, (7) implementing a quality management system, (8) conducting environmental training, (9) reducing the use of fossil fuels, (10) Reducing emissions of construction equipment, (11) using recycled materials, (12) using materials near the project site, (13) maintaining drainage channels, (14) constructing retaining wall to prevent soil sliding, (15) pavement management system, (16) road infrastructure maintenance, and (17) road preservation.
Experts provide various explanations for why they chose the most relevant component. They emphasize that life cycle cost analysis is a relevant sustainability component for local roads. This component should be applied for a component for sustainability at the design phase of local road pavement. It involves the formulation of project objectives, planning recommendations, standards used, construction methods, maintenance (reconstruction), terms of reference to handle environmental impacts, estimated construction and maintenance costs, and economic-social-environmental benefits. An example of a project life cycle cost analysis is represented by a road project feasibility study or a project economic study.
With regard to the relevance of components, the experts were agreed that road safety planning, long-life pavement design, environmental management system, water-permeable pavement, and use and recycle material, should be applied for indicators for sustainability at the design phase of local road. Road safety is a paramount indicator. It should be design properly for road geometry and facilities (road signs and marks). It guaranties the safety of traffic during construction and operation. An example of road safety planning includes designing traffic management during construction by redirecting traffic flow with the installation of traffic signs, constructing noise barriers, or planting trees to reduce road noise while considering conditions during road operation.
Long life design approach ensure that the local road network will have prolonged service life. Therefore, minimize road maintenance activities that leads to reducing greenhouse gas emissions and road pavement maintenance costs. The pavement service life design is intended to guarantee durability. For example, the design of flexible pavement specifies a service life of 40 years for the base layer and 20 years for the surface layer, whereas the design of concrete pavement has a service life of 40 years. The environmental management system is required that road contractors have an environmental management system certificate in order to ensure they understand the processes involved in managing the environmental aspect during the construction. For example, a contractor has an environmental management system certificate, such as SNI 19-14001-2005 or ISO 14001:2004
Water permeable pavement is relevant for environmental and pavement structure. Pervious pavement allows storm water to permeate to the subgrade, therefore reducing water inundation on top of the pavement and minimizing disturbance to the pavement structure while saving rainwater in the ground. For instance, porous pavement allows surface water to seep through and drain, and it is designed with an outlet system to manage excess water when capacity is surpassed. Expert stressed that reuse and recycle material is relevant for environmental. These materials are relatively inexpensive to reduce environmental impacts compared to the use of new materials, fossil fuels when transporting new materials, and reducing the volume of discarded materials. For example, demolition materials can be utilized as recycled materials in a road project, either through on-site mixing or processing at a material plant. Reclaimed asphalt from ACWC pavement may serve as a primary alternative, with a minimum of 10% of the total asphalt binder required.
Expert emphasized that implementing a quality management system should be applied for an indicator for sustainability at the construction phase of local road pavement. This means roads need to be constructed in compliance with quality standards related to human resources, materials, and equipment, thereby, indicating the significant importance of a quality management system as a sustainability criterion in local road construction. For example, a construction contractor holds a quality management system certification, ensuring that both construction execution and final products adhere to quality standards throughout the bidding process.
Experts ware agreed that conducting environmental training as a component to assure the sustainability of local roads. This is necessary to increase the environmental awareness and insight of the construction personnel and also to identify the best practical methods to minimize the impact of the road on the environment. The training materials include the principles of green road development and the policies formulated by the project stakeholders to apply them in the ongoing road project activities. For instance, there are training sessions for construction workers on proper disposal of leftover materials before starting work.
Other components for local road sustainability are reducing the use of fossil fuels and the emission of equipment emission. Using biofuels or biofuel blends for project equipment, machinery, and vehicles can reduce the demand for fossil fuels. Reducing the emission of equipment can be conducted by using equipment that meet the emission standards such as operating vehicles that are less than three years old and using by environmentally friendly fuels.
Experts selected that using materials available near to the project is relevant for environmental, economic and social aspect. The utilization of this criterion is expected to reduce the use of fossil fuels, thereby reducing the environmental impact of transporting materials, generating local economies and income equality. For instance, the use of aggregate resources obtained within an 80-kilometer radius of the project site.
The next component agreed by the experts is maintaining drainage channels. This component should be implemented at construction stage of local roads. It involves draining water to safeguard the pavement structure, to prevent environmental disturbances due to eroded soil sedimentation, and to prevent the loss of water sources during construction. This component example encompasses the provision of slope drainage, sediment traps, and the organization of drainage systems utilizing either open or closed channels.
Constructing retaining wall to prevent soil sliding was agreed the experts to be included in the list of local roads sustainability components. The component should be employed in the construction phase of local road. It is intended to protect the environment by minimizing the exposed land area. For instance, constructing retaining walls in regions with elevation differences (slopes) and building retaining walls to prevent fill soil from collapsing onto roads.
Table 9. Interquartile range (IQR), the percentage of ‘agree’ and ‘strongly agree’ (% agree), and standard deviation (SD) on the second Delphi round
|
Components ID |
IQR |
% agree |
SD |
|
Life cycle cost analysis* (D1) |
1* |
84.85* |
0.87* |
|
Road safety planning* (D2) |
1* |
84.85* |
0.93* |
|
Long-life pavement design* (D3) |
1* |
96.97* |
0.53* |
|
Porous pavement design (D4) |
2 |
63.64 |
1.19 |
|
Warm asphalt mix planning (D5) |
2 |
66.67 |
0.89 |
|
Cold asphalt mix planning (D6) |
1 |
54.55 |
0.95 |
|
Quiet Pavement Planning (D7) |
2 |
66.67 |
0.97 |
|
Road Alignment Design (D8) |
1 |
71.82 |
0.82 |
|
Replace the median hardened* (D9) |
1* |
84.85* |
0.98* |
|
Environmental management system (D10) |
1 |
57.58 |
1.30 |
|
Reduction hardened shoulder (D11) |
2 |
60.61 |
1.08 |
|
Replace the median hardened (D12) |
2 |
62.64 |
1.31 |
|
Water-permeable pavement* (D13) |
1* |
75.76* |
0.92* |
|
Reuse and recycle materials* (D14) |
1* |
84.85* |
0.80* |
|
Implementing a quality management system* (C1) |
1* |
90.91* |
0.67* |
|
Conducting environmental training* (C2) |
1* |
87.88* |
0.70* |
|
Reducing the use of fossil fuels* (C3) |
1* |
78.79* |
0.86* |
|
Reducing emissions of construction equipment* (C4) |
1* |
84.85* |
0.90* |
|
Reducing emission on site (C5) |
1 |
74.76 |
0.91 |
|
Using recycled materials* (C6) |
1* |
78.79* |
0.99* |
|
Using materials near the project site* (C7) |
1* |
84.85* |
1.00* |
|
Waste management (C8) |
2 |
72.73 |
0.95 |
|
Maintaining drainage channels* (C9) |
1* |
93.94* |
0.83* |
|
Constructing retaining wall to prevent soil sliding* (C10) |
1* |
90.91* |
0.77* |
|
Pavement management system* (M1) |
1* |
96.97* |
0.57* |
|
Road infrastructure maintenance* (M2) |
1* |
87.88* |
0.71* |
|
Control work zone traffic (M3) |
2 |
69.70 |
0.84 |
|
Road preservation* (M4) |
1* |
78.79* |
1.00* |
*The components that satisfy three combinations measurement
The pavement management system, road infrastructure maintenance, and road preservation were agreed by the experts to be a component for sustainability at the maintenance stage of local road pavement. The pavement management system allows stakeholders to maintain and rehabilitate local road under budget constraint. For example, utilizing a Pavement Management Program (PMP) to evaluate and monitor the current and past conditions of pavement helps to make cost-effective decisions regarding maintenance and required rehabilitation. Road infrastructure maintenance is intended to protect the environment and pavement. Maintaining road infrastructure includes pothole and crack repairs, debris removal, shoulder trimming, sign and marking installation, and routine monitoring of road conditions. Road preservation is a road work activity which involves maintaining and repairing roads to ensure they serve traffic optimally and achieve the specified project life. The quality of road maintenance work is one indication of success in the strategy of achieving the planned life of road pavement as discussed in the literature [25]. Road preservation encompasses routine maintenance, preventive maintenance, rehabilitation, and reconstruction.
It was discovered that eleven out of these components are categorized in the environmental dimensions. These include conducting environmental training; reducing the use of fossil fuels; reducing emissions of construction equipment; using recycled materials; maintaining drainage channels; constructing retaining wall to prevent soil sliding, long life pavement design, road alignment design, environmental management system; water-permeable pavement; and road infrastructure maintenance.
Four components are economic dimensions and they include life cycle cost analysis, using materials near the project site, pavement management systems, and road preservation. Meanwhile two components are social dimensions. These indicators are using materials near the project site and road safety planning.
Overall, these seventeen local roads sustainability components involve all the three pillars of sustainability; planet; people; and profit. These integrated components are in agreement with the findings of previous studies that the social and economic dimensions are very important to sustainable development [1,2,3,4,5,8]. It can be simply stated that economic and social issues, particularly those related to health, safety, and equity, have become more relevant to sustainability. Moreover, the experts emphasized that using the materials near the project site can be classified as an environmental-economic-social dimension because it covers the three dimensions as indicated by the reduction in the environmental impacts due to transportation of materials which is an environmental dimension, generating local economies which is an economic dimension, and income equality which is a social dimension.
4 Conclusions
This study showed that Delphi method can support the identification of several sustainability indicators which were not obvious to the group of expert respondents in the first place. These indicators were observed to include implementing a quality management system, conducting environ-mental training, reducing the use of fossil fuels, Reducing emissions of construction equipment, using recycled materials, using materials near the project site, maintaining drainage channels, constructing retaining wall to prevent soil sliding, life cycle cost analysis, road safety planning, long life pavement design, road alignment design, environmental management system, water-permeable pavement, pavement management system, road infrastructure maintenance, and road preservation. It is acknowledged that the seventeen local road sustainability indicators reflect the all sustainability pillars.
Acknowledgements
The Authors would like to acknowledge students at Civil Engineering Department, Faculty of engineering, Sebelas Maret University for their support during data collection. The funding of Penelitian Unggulan Terapan (PUT) scheme from Institute for Research and Community Service Sebelas Maret University is also appreciated.
References
- Hansmann, R., Mieg, H. A., & Frischknecht, P. (2012). Principal sustainability components: Empirical analysis of synergies between the three pillars of sustainability. International Journal Sustainable Development World Ecology, vol. 19, no. 5, 451–459, DOI: 10.1080/13504509.2012.696220.
- Hassan, A. M., & Lee, H. (2014). The paradox of the sustainable city : definitions and examples. Environ Dev Sustain, DOI: 10.1007/s10668-014-9604-z.
- Huang, L., Wu, J., & Yan, L. (2015). Defining and measuring urban sustainability : a review of indicators. Landscape Ecol. DOI: 10.1007/s10980-015-0208-2.
- Tanguay, G. A., Rajaonson, J., & Lanoie, P. (2010). Measuring the sustainability of cities : An analysis of the use of local indicators. Ecological Indicators, vol. 10, 407–418, DOI: 10.1016/j.ecolind.2009.07.013.
- Michael, F. L., Noor, Z. Z., & Figueroa, M. J. (2014). Review of urban sustainability indicators assessment- Case study between Asian countries. Habitat Interbational, vol. 44, 491–500, DOI: 10.1016/j.habitatint.2014.09.006.
- Handayani, F. S., Pramesti, F. P., Wibowo, M. A., & Setyawan A. (2019). Estimating and reducing the release of Greenhouse Gases in local road pavement constructions. International Journal Advanced Science Engineering Information Technology, vol. 9, no. 5, 1709–1715, DOI: 10.18517/ijaseit.9.5.9705.
- Pradhan, P., Costa, L., Rybski, D., Lucht, W., & Kropp, J. P. (2017). A Systematic Study of Sustainable Development Goal (SDG) Interactions. Earth’s Future, vol. 5, no. 11, 1169–1179, DOI: 10.1002/2017EF000632.
- Meijering, J. V., Kern K., & Tobi, H. (2014). Identifying the methodological characteristics of European green city rankings. Ecological Indicators, vol. 43, 132–142, DOI: 10.1016/j.ecolind.2014.02.026.
- Lohuis, A. M., van Vuuren, M., & Bohlmeijer, E. (2014). Context-specific definitions of organizational concepts: Defining 'team effectiveness' with use of Delphi Technique. Journal of Management & Organization, vol. 19 no. 06, 706–720, DOI: 10.1017/jmo.2014.10.
- Ferguson, N. D., Davis, A. M., Slutsky, A. S., & Stewart, T., E. (2005). Development of a clinical definition for acute respiratory distress syndrome using the Delphi technique. Journal of Critical Care, no. 20, 147–154, DOI: 10.1016/j.jcrc.2005.03.001.
- Chu, H. C., & Hwang, G. J. (2008). A Delphi-based approach to developing expert systems with the cooperation of multiple experts. Expert Systems with Applications, vol. 34, 2826–2840, DOI: 10.1016/j.eswa.2007.05.034.
- De Brito, M. M., Evers, M., & Höllermann, B. (2017). Prioritization of flood vulnerability, coping capacity and exposure indicators through the Delphi technique : A case study in Taquari-Antas basin , Brazil. International Journal of Disaster Risk Reduction, vol. 24, 119–128, DOI: 10.1016/j.ijdrr.2017.05.027.
- Meijering, J. V., Kampen, J. K., & Tobi,H. (2013). Quantifying the development of agreement among experts in Delphi studies. Technological Forecasting & Social Change, vol. 80, no. 8, 1607–1614, DOI: 10.1016/j.techfore.2013.01.003.
- Rietbergen-mccracken, J., & Narayan, D. (1998). Participation and Social Assessment : Tool and Techniques. The International Bank for Reconstruction and Development, Washington, D.C, USA.
- Giannarou, L., & Zervas, E. (2014). Using Delphi technique to build consensus in practice. International Journal of Business Science Applied Management, vol. 9, no. 2, 65–82, :10.69864/ijbsam.9-2.106.
- NYSDOT., (2010). New York State Departement of Transportation. NYSDOT sustainability&GreenLITES.
- Muench, S., Anderson, J., & Hatfield, J. (2011). Greenroads Manual v1. Seattle. http://scholar.google.com/scholar?hl=en&btnG=Search&q=intitle:Greenroads+Manual+v1.5#0
- Vicroads, (2011). Integrated Vicroads Environmental Sustainability Tool (INVEST). Washiington DC: Vicroads Environmental Sustainability, Federal Highway Administration Washington DC.
- Knuth, D., & Fortmann, J. (2011). The Development of I-LAST TM Illinois - Livable and Sustainable Transportation,” pp. 495–503.
- Wilis, G. (2005). Cognitive Interviewing. A Tool for Improving Questionnaire Design. Sage Publications, Thousand Oaks. https://dx.doi.org/10.4135/9781412983655
- Diamond, I. R., Grant, R. C., Feldman, B. M., Pencharz, P. B., Ling, S. C., Moore, A. M., & Wales, P.W. (2014). Defining consensus: A systematic review recommends methodologic criteria for reporting of Delphi studies. Journal of Clinical Epidemiology, vol. 67, no. 4, 401–409, DOI: 10.1016/j.jclinepi.2013.12.002.
- Shah, H. A. (2009). Which Is the Best Parametric Statistical Method For Analyzing Delphi Data ?. Journal of Modern Applied Statistical Methods, vol. 8, no. 1, 226-232, DOI: 10.22237/jmasm/1241137140.
- Von der Gracht, H. A. (2012). Consensus measurement in Delphi studies. Review and implications for future quality assurance. Technological Forecasting & Social Change, vol. 79, 1525–1536, DOI: 10.1016/j.techfore.2012.04.013.
- Alshehri, S. A., Rezgui, Y., & Li, H. (2015). Delphi-based consensus study into a framework of community resilience to disaster. Nat. Hazards, vol. 75, 2221–2245, DOI: 10.1007/s11069-014-1423-x.
- Sita, T., Mulyono, A. T., & Utomo, S.H. (2023). Analyzing the Effect of Road Performance Indicators on Penalties for Late Fulfillment in Road Service Levels. Journal of Applied Engineering Science, vol. 21, no. 1, 176–187, DOI: 10.5937/jaes0-39785.
Conflict of Interest Statement
There are no conflicts affecting the research.
Author Contributions
Data Availability Statement
There is no dataset associated with the study or data is not shared.
Supplementary Materials
There are no supplementary materials to include.