Volume 24 article 1350 pages: 518-529
Received: Mar 06, 2026 Accepted: Jul 21, 2026 Available Online: Aug 03, 2026 Published: Aug 17, 2026
DOI: 10.5937/jaes0-65307
INFLUENCE OF WELDING SPEED ON THE MECHANICAL PERFORMANCE AND MICROSTRUCTURAL EVOLUTION OF GMAW-WELDED SS400 STEEL
Abstract
This study investigated the effect of welding speed on the tensile properties, hardness distribution, and microstructural evolution of robotic Gas Metal Arc Welding (GMAW)-welded SS400 steel joints. Single-pass V-groove butt joints were welded at travel speeds of 40, 50, and 60 cm/min, while welding current, arc voltage, wire-feed rate, shielding gas, and joint geometry were kept constant. Tensile testing, Vickers microhardness testing, and metallographic observation were conducted according to ASTM E8/E8M, ASTM E92, and ASTM E407, respectively. The highest mean ultimate tensile strength and yield strength were obtained at 40 cm/min, with an ultimate tensile strength of 458.50 MPa. The weld metal showed the highest hardness, with peak values of approximately 230–250 HV0.3, depending on welding speed. Changes in welding speed altered the calculated heat input and affected ferrite–pearlite morphology across the weld metal, heat-affected zone, and base metal. Although 40 cm/min produced the highest tensile response, 50 cm/min showed the most balanced combination of tensile properties, hardness uniformity, and relatively homogeneous ferrite–pearlite morphology. Therefore, 50 cm/min can be considered a suitable welding speed for achieving balanced mechanical and microstructural characteristics under the present experimental conditions.
Highlights
- Welding speed affected SS400 GMAW joint properties.
- Peak mean UTS (458.50 MPa) and YS (355.14 MPa) occurred at 40 cm/min.
- Weld metal showed the highest peak hardness (approximately 230–250 HV0.3).
- 50 cm/min provided balanced mechanical and microstructural characteristics.
Keywords
Content
1 Introduction
SS400 has been investigated in various welded-joint applications. In underwater wet welding, welding parameters and water depth were reported to affect corrosion behaviour and fatigue life, respectively [1, 2]. Studies on dissimilar SS400–SUS304 joints showed that welding current and welding speed influence tensile strength and hardness [3]. Single-pass hot-wire GMAW of SS400 square-butt joints also demonstrated that welding conditions affect bead formation, penetration, and joint quality [4]. In robotic MIG welding of SS400–SUS304 joints, welding current, arc voltage, welding speed, and electrical stick-out affected tensile strength, while distinct microstructures were observed across the weld and HAZ [5]. Appropriate combinations of welding current and speed are also important for achieving high efficiency hot-wire GMAW with relatively low heat input [6].
GMAW is widely used for steel joining because of its high productivity, flexibility, and suitability for automation, although weld quality remains strongly dependent on process parameters [7]. These parameters can modify the mechanical properties and microstructure of welded joints [8]. In structural steels, welding current, arc voltage, shielding-gas flow rate, filler-metal selection, and wire-feed speed have been reported to affect tensile strength, hardness, weld geometry, residual stress, and weld-zone microstructure [9, 10, 11].
Welding speed is particularly important because, at constant current and voltage, increasing travel speed reduces the calculated heat input per unit weld length. Welding parameters can affect HAZ width [12], while excessively high travel speeds may destabilize the molten pool and promote humping defects [13]. Linear heat input also influences bead geometry and hardness in GMAW coatings [14], whereas different short-circuit waveforms can produce different thermal, mechanical, and microstructural responses [15].
The thermal cycle generated during GMAW governs HAZ microstructure and hardness [16]. Changes in heat input can modify grain size, phase morphology, microhardness, and impact toughness [17]. In high-strength steels, localized HAZ softening may also influence tensile response and fracture behaviour [18]. Moreover, the selected welding process can affect the mechanical and microstructural characteristics of structural-steel joints [19].
Despite these studies, integrated evaluations of welding-speed effects on calculated heat input, tensile properties, hardness distribution, and microstructural evolution in robotic GMAW-welded similar-metal SS400 joints remain limited. Therefore, this study investigates these effects to determine a suitable welding-speed condition for SS400 welded joints.
2 Materials and methods
2.1 Materials and chemical composition
Optical emission spectroscopy (OES) confirmed that the investigated steel was a low-carbon steel, containing 0.17 wt.% C, 0.694 wt.% Si, 0.256 wt.% Mn, 0.003 wt.% P, 0.016 wt.% S, and 98.06 wt.% Fe. The low carbon content indicates good weldability and suitability for GMAW processing.
2.2 GMAW welding procedure
SS400 steel plates measuring 150 mm × 400 mm × 6 mm were welded in the flat position (1G) using a single-pass, single-sided V-groove butt joint. The joint geometry, selected with reference to AWS D1.1/D1.1M [20], consisted of a 60° included groove angle, a 1 mm root face, and a 2 mm root gap, as shown in Fig. 1. This configuration was maintained for all specimens to ensure consistent root access and isolate the effect of welding speed.
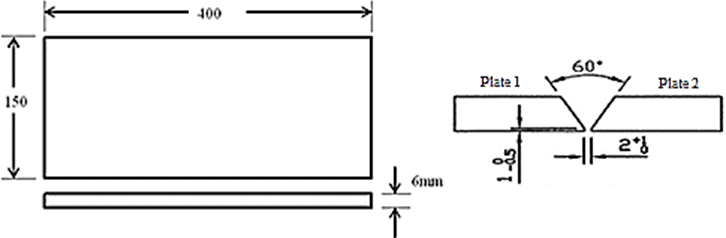
Fig. 1. SS400 plate dimensions and single-pass V-groove butt-joint geometry (all dimensions in mm)
Robotic GMAW was used to ensure repeatable torch motion and minimise operator-related variability. Each specimen was welded from one side in one continuous V-groove pass without separate root, filler, or cap passes. Welding speed varied at 40, 50, and 60 cm/min, while the welding current (150 A), arc voltage (25 V), wire-feed rate (10 m/min), shielding-gas condition, filler wire, and joint geometry were maintained constantly to isolate the effect of welding speed. The robotic welding setup and operation are shown in Fig. 2.
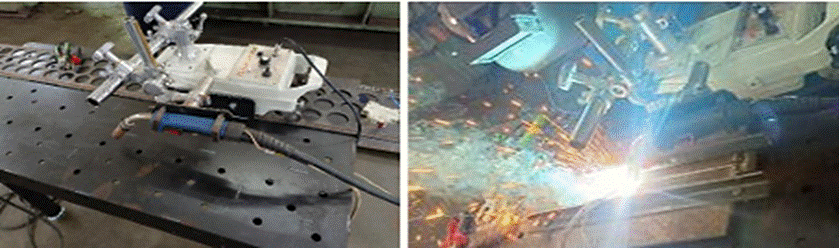
Fig. 2. Robotic GMAW welding: (a) welding setup and (b) welding operation
An Ar–18%CO₂ shielding gas was supplied at a constant flow rate of 17 L/min using a 1.2 mm ER70S-6 wire. The gas composition and flow rate were maintained constant because shielding-gas conditions can affect molten-pool behaviour and weld-bead formation [21]. Welding was performed indoors to minimise airflow disturbance, as crosswind can disrupt shielding-gas coverage during gas-shielded arc welding [22]. The complete welding parameters are listed in Table 1.
Table 1. Welding parameters
|
Parameter |
Specification |
|
Base material |
SS400 steel |
|
Plate dimensions |
400 mm × 150 mm × 6 mm |
|
Welding process |
Robotic GMAW |
|
Joint type |
Single-pass, single-sided V-groove butt joint |
|
Welding position |
Flat position (1G) |
|
Included groove angle |
60° |
|
Root face |
1 mm |
|
Root gap |
2 mm |
|
Number of passes |
One continuous pass |
|
Welding speed |
40, 50, and 60 cm/min |
|
Arc voltage |
25 V |
|
Welding current |
150 A |
|
Wire-feed rate |
10 m/min |
|
Contact tip to work distance |
12 mm |
|
Polarity |
DCEP |
|
Torch angle |
15° travel angle |
|
Shielding gas |
Ar 82% + CO₂ 18% |
|
Gas flow rate |
17 L/min |
|
Filler wire |
ER70S-6, Ø 1.2 mm |
|
Preheating temperature |
Not applied |
|
Interpass temperature |
Not applicable, single-pass welding |
|
Welding efficiency, η |
0.8 |
|
Heat input at 40 cm/min |
0.450 kJ/mm |
|
Heat input at 50 cm/min |
0.360 kJ/mm |
|
Heat input at 60 cm/min |
0.300 kJ/mm |
The calculated heat input was determined using Eq. (1), adopting a thermal efficiency factor of η = 0.8 for the GMAW process in accordance with BS EN 1011-1:2009 [23].
where HI is the heat input (kJ/mm), η is the GMAW thermal efficiency (0.8), V is the arc voltage, I is the welding current, and S is the welding speed. At constant values of 25 V and 150 A, heat input decreased from 0.450 to 0.360 and 0.300 kJ/mm as the welding speed increased from 40 to 50 and 60 cm/min, respectively. Heat input was evaluated because variations in GMAW heat input can modify the welding thermal cycle and consequently affect the HAZ microstructure and hardness distribution [8, 16].
After welding, all joints were visually inspected and tested using the Magnaflux Spotcheck aerosol system: SKC-S cleaner, SKL-SP2 visible red penetrant, and SKD-S2 developer. Penetrant dwell and development times were 7–10 min each, followed by visual examination under white light in reference to EN ISO 3452-1:2021 and ISO 23277:2015.
2.3 Tensile testing
Transverse tensile specimens were extracted approximately 100 mm from the plate ends, with the weld centred in the gauge length. Testing was conducted according to ASTM E8/E8M using a 100 kN universal testing machine at a crosshead rate of 1 mm/min. Yield strength, ultimate tensile strength, and elongation were measured for three specimens at each welding speed and reported as mean ± standard deviation, while the fracture location was recorded for each specimen.
2.4 Hardness testing
Vickers microhardness testing was performed according to ASTM E92 using a 300 gf load (HV0.3) and a dwell time of 15 s. Twenty-one indentations were made at 1 mm centre-to-centre intervals along a horizontal traverse across the weld cross-section, with the weld centre defined as coordinate 0 mm. The measurement positions extended from −10 to +10 mm and comprised eight BM points, six HAZ points, and seven WM points.
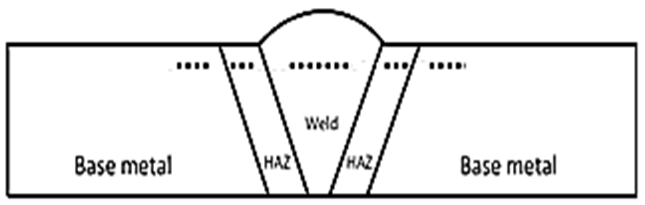
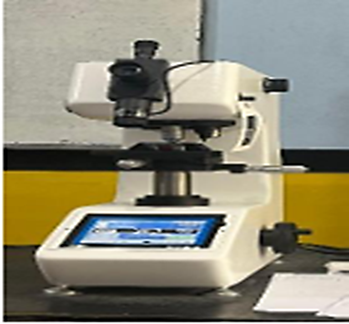
Fig. 3. Vickers microhardness testing: (a) measurement path across the base metal (BM), heat-affected zone (HAZ), and weld metal (WM); and (b) Vickers microhardness tester
2.5 Metallographic preparation and microstructural analysis
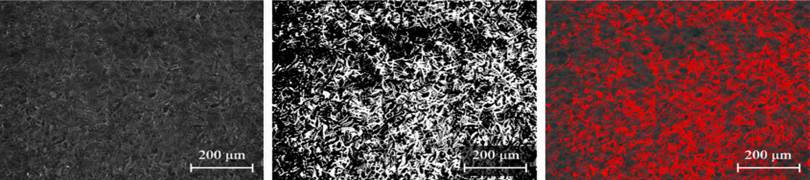
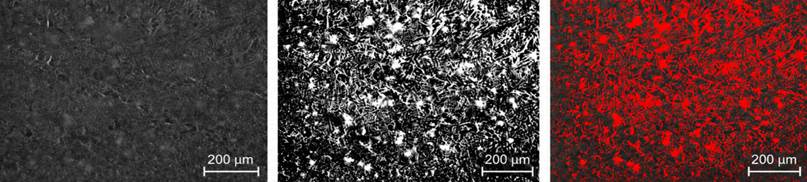
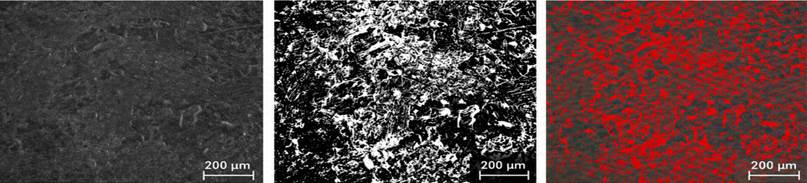
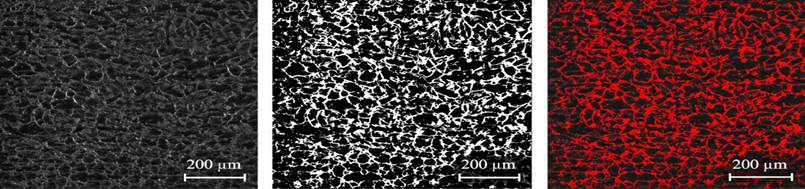
Welded SS400 cross-sections covering the BM, HAZ, and WM were ground using 240–5000 grit papers, polished with 1 μm alumina, and etched with 2–5% Nital in accordance with ASTM E407. Three non-overlapping fields from each zone and welding condition were acquired at 50× magnification with 200 μm scale bars and analysed semi-quantitatively using ImageJ 1.54. After scale calibration, the images were converted to 8-bit grayscale and segmented using the Default automatic threshold, with the lighter and darker regions interpreted as ferrite and pearlite, respectively. Phase-area fractions were estimated from the thresholded pixel areas following an ImageJ-based image-analysis approach [24] and reported as mean ± standard deviation from three fields.
3 Results and discussion
3.1 Non-destructive testing

Fig. 4. Visual inspection and liquid penetrant testing results of joints welded at (a) 40, (b) 50, and (c) 60 cm/min. The arrow and ellipse indicate localized underfill in the 60 cm/min joint
As shown in Fig. 4, the 40 and 50 cm/min joints exhibited relatively uniform bead profiles, with the most uniform appearance at 50 cm/min. Localized underfill was visually identified at 60 cm/min, whereas LPT revealed no relevant surface-breaking indications. The underfilled joint was still used for tensile testing; therefore, the local cross-sectional reduction and stress concentration may have contributed to the lower YS and weld-metal fracture, although their effects could not be isolated from other welding-related factors.
3.2 Tensile testing
Tensile testing evaluated UTS, YS, elongation, and fracture location at welding speeds of 40, 50, and 60 cm/min. Results are presented as mean ± standard deviation from three specimens. Specimens welded at 40 and 50 cm/min fractured in the BM, whereas those welded at 60 cm/min fractured in the WM, possibly due to lower heat input and localized underfill. Fractographic analysis was not conducted.

Fig. 5. Tensile specimens after testing: Base Metal (BM) and GMAW-welded specimens at welding speeds of 40, 50, and 60 cm/min
Table 2. Tensile properties of the base metal and GMAW-welded SS400 joints
|
Condition |
Replicate |
UTS (MPa) |
YS (MPa) |
Elongation (%) |
Fracture location |
|
BM SS400 |
1 |
448.97 |
348.23 |
24 |
BM |
|
2 |
453.02 |
349.01 |
24 |
BM |
|
|
3 |
445.67 |
345.59 |
24 |
BM |
|
|
Mean ± SD |
449.22 ± 3.68 |
347.61 ± 1.79 |
24.0 ± 0.0 |
— |
|
|
40 cm/min |
1 |
458.12 |
350.11 |
23 |
BM |
|
2 |
455.62 |
361.97 |
24 |
BM |
|
|
3 |
461.76 |
353.35 |
23 |
BM |
|
|
Mean ± SD |
458.50 ± 3.09 |
355.14 ± 6.13 |
23.3 ± 0.6 |
— |
|
|
50 cm/min |
1 |
452.33 |
361.70 |
22 |
BM |
|
2 |
455.15 |
312.65 |
22 |
BM |
|
|
3 |
452.63 |
346.40 |
24 |
BM |
|
|
Mean ± SD |
453.37 ± 1.55 |
340.25 ± 25.10 |
22.7 ± 1.2 |
— |
|
|
60 cm/min |
1 |
430.83 |
306.85 |
23 |
WM |
|
2 |
469.75 |
347.70 |
23 |
WM |
|
|
3 |
447.14 |
349.14 |
23 |
WM |
|
|
Mean ± SD |
449.24 ± 19.55 |
334.57 ± 24.01 |
23.0 ± 0.0 |
— |
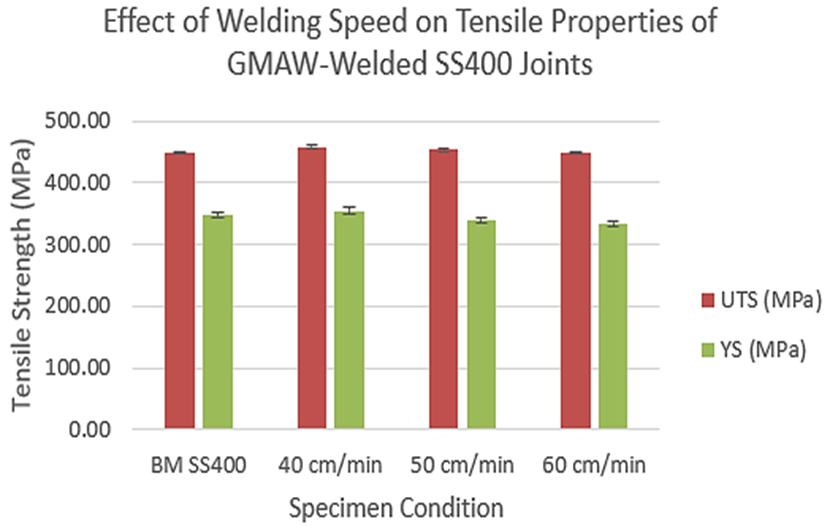
Fig. 6. Ultimate tensile strength and yield strength of the base metal and GMAW-welded SS400 joints at different welding speeds. Error bars represent the standard deviation of three specimens
As shown in Fig. 6, the highest means UTS and YS were obtained at 40 cm/min, reaching 458.50 ± 3.09 MPa and 355.14 ± 6.13 MPa, respectively. At 50 cm/min, the mean UTS and YS decreased to 453.37 ± 1.55 MPa and 340.25 ± 25.10 MPa, respectively. At 60 cm/min, the mean UTS was 449.24 ± 19.55 MPa, close to that of the base metal, while the mean YS decreased to 334.57 ± 24.01 MPa. The reduction in mean strength with increasing welding speed may be associated with the corresponding decrease in calculated heat input. Changes in welding speed can affect weld-bead geometry and microstructural evolution [25], while welding thermal conditions can modify the microstructure and mechanical response of the HAZ [26]. Localized underfill and weld-metal fracture at 60 cm/min may have affected the tensile response, while the high YS variability at 50 cm/min and UTS–YS variability at 60 cm/min indicates specimen-to-specimen scatter. Without inferential statistical testing, these differences are interpreted only as descriptive trends.
3.3 Hardness testing
Vickers hardness testing was performed to evaluate the effect of welding speed on SS400 steel, with measurements taken in the base metal (BM), heat-affected zone (HAZ), and weld metal (WM).
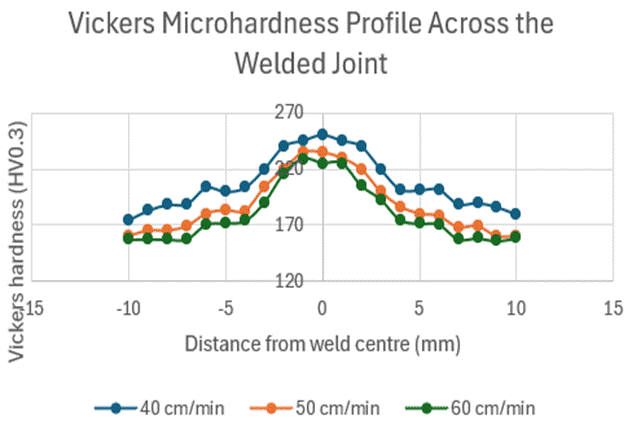
Fig. 7. Vickers microhardness profiles across the BM–HAZ–WM–HAZ–BM regions of GMAW-welded SS400 joints at welding speeds of 40, 50, and 60 cm/min
Figure 7 shows the HV0.3 profiles across the BM–HAZ–WM–HAZ–BM regions. For all welding speeds, hardness generally increased from BM toward the WM and subsequently decreased toward the opposite BM. The maximum hardness occurred in the WM, reaching approximately 250, 235, and 230 HV0.3 at welding speeds of 40, 50, and 60 cm/min, respectively. Previous GMAW studies have shown that welding speed and heat input can affect weld-zone hardness through changes in the thermal cycle and microstructural evolution [27]. Higher weld-metal hardness has also been associated with weld-metal microstructure and solidification characteristics [28]. Although minor variations occurred between the two sides of the weld centre, the overall profiles were comparable. The 50 cm/min condition showed the smoothest hardness transition and the most uniform hardness distribution.
3.4 Microstructural analysis
3.4.1 Microstructures at a welding speed of 40 cm/min
|
Grayscale |
Threshold |
Overlay |
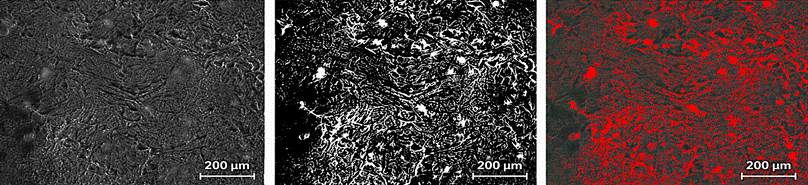
Fig. 8. Optical micrograph and ImageJ segmentation of the weld metal at a welding speed of 40 cm/min using a 50× objective lens; scale bar = 200 μm
|
Grayscale |
Threshold |
Overlay |
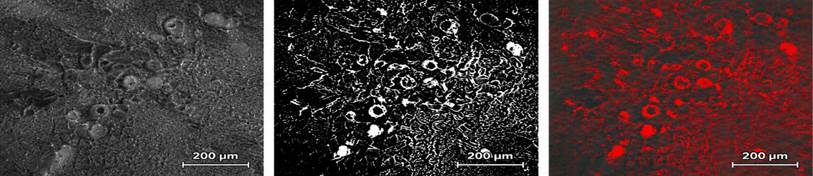
Fig. 9. Optical micrograph and ImageJ segmentation of the heat affected zone at a welding speed of 40 cm/min using a 50× objective lens; scale bar = 200 μm
|
Grayscale |
Threshold |
Overlay |
Fig. 10. Optical micrograph and ImageJ segmentation of the base metal at a welding speed of 40 cm/min using a 50× objective lens; scale bar = 200 μm
3.4.2 Microstructures at a welding speed of 50 cm/min
|
Grayscale |
Threshold |
Overlay |
Fig. 11. Optical micrograph and ImageJ segmentation of the weld metal at a welding speed of 50 cm/min using a 50× objective lens; scale bar = 200 μm
|
Grayscale |
Threshold |
Overlay |
Fig. 12. Optical micrograph and ImageJ segmentation of the heat-affected zone at a welding speed of 50 cm/min using a 50× objective lens; scale bar = 200 μm
|
Grayscale |
Threshold |
Overlay |
Fig. 13. Optical micrograph and ImageJ segmentation of the base metal at a welding speed of 50 cm/min using a 50× objective lens; scale bar = 200 μm
3.4.3 Microstructures at a welding speed of 60 cm/min
|
Grayscale |
Threshold |
Overlay |
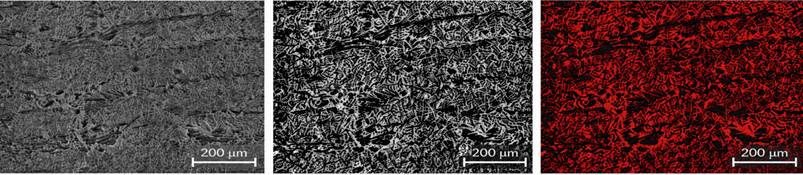
Fig. 14. Optical micrograph and ImageJ segmentation of the weld metal at a welding speed of 60 cm/min using a 50× objective lens; scale bar = 200 μm
|
Grayscale |
Threshold |
Overlay |
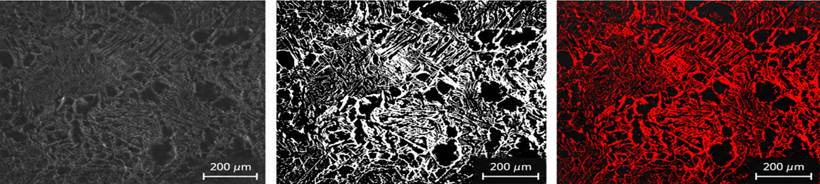
Fig. 15. Optical micrograph and ImageJ segmentation of the heat-affected zone at a welding speed of 60 cm/min using a 50× objective lens; scale bar = 200 μm
|
Grayscale |
Threshold |
Overlay |
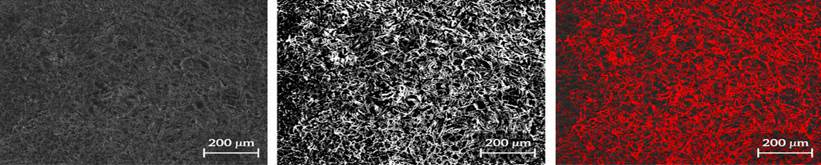
Fig. 16. Optical micrograph and ImageJ segmentation of the base metal at a welding speed of 60 cm/min using a 50× objective lens; scale bar = 200 μm
Table 3. Microstructure segmentation summary
|
Welding speed |
Heat input |
Zone |
Estimated ferrite area fraction, mean ± SD (%) |
Estimated pearlite area fraction, mean ± SD (%) |
Morphology |
Microstructural characteristics |
|
40 cm/min |
0.450 kJ/mm |
WM |
71.33 ± 3.06 |
28.67 ± 3.06 |
Ferrite-dominant structure with interlocking and locally directional features |
The WM exhibited a relatively compact ferrite-dominant structure with dispersed pearlite regions. The observed morphology was associated with the highest calculated heat input among the investigated conditions. |
|
HAZ |
65.67 ± 4.04 |
34.33 ± 4.04 |
Partially transformed ferrite–pearlite structure |
The HAZ exhibited a heterogeneous transitional microstructure associated with relatively high thermal exposure. |
||
|
BM |
80.67 ± 3.06 |
19.33 ± 3.06 |
Equiaxed ferrite–pearlite structure |
The BM retained a relatively uniform ferrite–pearlite microstructure outside the visibly affected welding region. |
||
|
50 cm/min |
0.360 kJ/mm |
WM |
73.00 ± 3.00 |
27.00 ± 3.00 |
Interlocking ferritic structure with locally equiaxed regions |
The WM showed a relatively uniform ferrite–pearlite distribution within the examined fields. |
|
HAZ |
68.00 ± 4.00 |
32.00 ± 4.00 |
Partially transformed ferrite–pearlite structure with locally heterogeneous regions |
The HAZ displayed a transitional microstructure between the WM and unaffected BM. |
||
|
BM |
79.33 ± 3.51 |
20.67 ± 3.51 |
Equiaxed ferrite–pearlite structure |
The BM retained a relatively stable ferritic matrix containing dispersed pearlite regions. |
||
|
60 cm/min |
0.300 kJ/mm |
WM |
75.00 ± 3.00 |
25.00 ± 3.00 |
Ferrite-dominant structure with locally directional features |
The WM exhibited a ferrite-dominant structure with dispersed pearlite regions under the lowest calculated heat-input condition. |
|
HAZ |
70.00 ± 4.00 |
30.00 ± 4.00 |
Partially transformed ferrite–pearlite structure |
The HAZ displayed a heterogeneous transitional ferrite–pearlite microstructure. |
||
|
BM |
80.33 ± 3.51 |
19.67 ± 3.51 |
Equiaxed ferrite–pearlite structure |
The BM remained relatively homogeneous and showed no evident systematic dependence on welding speed. |
Note: Values are reported as mean ± standard deviation from three fields. Ferrite and pearlite were semi-quantitatively identified as light and dark regions, respectively, using calibrated grayscale thresholding in ImageJ 1.54.
Microstructural differences were evaluated in relation to the calculated heat input. At 40 cm/min (0.450 kJ/mm), the WM exhibited a compact ferrite-dominant structure with dispersed pearlite, while the HAZ showed a heterogeneous transitional ferrite–pearlite morphology, consistent with relatively high thermal exposure [29]. At 50 cm/min (0.360 kJ/mm), the WM showed the most uniform ferrite–pearlite distribution, whereas the HAZ retained a transitional morphology between the WM and BM [30]. At 60 cm/min (0.300 kJ/mm), the WM exhibited locally directional ferritic features and a slightly higher ferrite fraction, which may be associated with the reduced heat input and altered thermal cycle [31]. The BM remained comparatively stable in all conditions. Overall, welding speed produced modest variations in phase-area fractions and morphology; however, no conclusion regarding grain refinement or cooling rate was made because these parameters were not directly measured.
3.5 Study limitations
This study was limited to 6 mm SS400 plates welded under the selected single-pass robotic GMAW conditions. Impact toughness was not evaluated, thermal cycles and cooling rates were not directly measured, and grain size was not quantified. Ferrite–pearlite fractions were estimated semi-quantitatively; therefore, the findings apply only to the investigated conditions.
4 Conclusions
Welding speed affected the tensile properties, distribution of hardness, and microstructural evolution of GMAW-welded SS400 joints. The highest mean ultimate tensile strength and yield strength were obtained at 40 cm/min, while the 50 cm/min condition showed a more balanced combination of tensile properties, hardness uniformity, and homogeneous ferrite–pearlite morphology. The 60 cm/min condition was associated with lower heat input, reduced yield strength, and localized underfill. Therefore, under the investigated conditions, a welding speed of 50 cm/min provided the most balanced combination of tensile properties, hardness uniformity, and ferrite–pearlite morphology.
Acknowledgements
This research did not receive any specific grant from funding agencies in the public, commercial, or non-profit sectors.
References
- Surojo, E., Wicaksana, N. I., Saputro, Y. C. N., Budiana, E. P., Muhayat, N., Triyono, & Prabowo, A. R. (2020). Effect of welding parameter on the corrosion rate of underwater wet welded SS400 low carbon steel. Applied Sciences, 10(17), 5843. https://doi.org/10.3390/app10175843
- Muhayat, N., Matien, Y. A., Sukanto, H., Saputro, Y. C. N., & Triyono. (2020). Fatigue life of underwater wet welded low carbon steel SS400. Heliyon, 6(2), e03366. https://doi.org/10.1016/j.heliyon.2020.e03366
- Mayai, A., Prasomthong, S., & Pookamnerd, Y. (2025). Development of hybrid ANN-GA and RSM models for optimizing mechanical properties in SS400-SUS304 welds. EUREKA: Physics and Engineering, (3), 152–165. https://doi.org/10.21303/2461-4262.2025.003606
- Suwannatee, N., & Yamamoto, M. (2023). Single-pass process of square butt joints without edge preparation using hot-wire gas metal arc welding. Metals, 13, 1014. https://doi.org/10.3390/met13061014
- Nguyen, V., Nguyen, T. T., Hoang, V. H., Thien, T. N., Thi, D., & Yen, K. (2025). Influence of post-heat treatment on the tensile strength and microstructure of metal inert gas dissimilar welded joints. Crystals, 15, 586. https://doi.org/10.3390/cryst15070586
- Marumoto, K., Fujinaga, A., Takahashi, T., Yamamoto, H., & Yamamoto, M. (2024). Selection of welding conditions for achieving both a high efficiency and low heat input for hot-wire gas metal arc welding. Journal of Manufacturing and Materials Processing, 8(2), 82. https://doi.org/10.3390/jmmp8020082
- Wordofa, T. N., & Ramulu, P. J. (2023). Gas metal arc welding input parameters impacts on weld quality characteristics of steel materials: A comprehensive exploration. Manufacturing Technology, 23(3), 366–379. https://doi.org/10.21062/mft.2023.046
- Chacón-Fernández, S., Portolés García, A., & Romaní Labanda, G. (2022). Analysis of the influence of GMAW process parameters on the properties and microstructure of S32001 steel. Materials, 15(18), 6498. https://doi.org/10.3390/ma15186498
- Shafeek, M., Suranjan, S., Doreswamy, D., & Sachidananda, H. K. (2024). Effect of welding parameters on microstructure and mechanical properties of GMAW welded S275 steel welded zone. Discover Materials, 4(1). https://doi.org/10.1007/s43939-024-00169-4
- Peter, A., Mutua, J., Obiko, J., & Ngoret, J. (2025). A comparative study on the effect of GMAW welding current on the performance of API 5L GrB pipeline steel welds for oil and gas industrial applications. Journal of Pipeline Science and Engineering, 6(3), 100360. https://doi.org/10.1016/j.jpse.2025.100360
- Chong, K., Mhd Noor, E. E., Amir, A., & Baig, M. F. (2024). Study on welding characteristics and parameters of gas metal arc welding for A516 grade 70 steel with ER70S-6 and ER308LSi filler materials. Materials, 17(21), 5391. https://doi.org/10.3390/ma17215391
- Mezaache, M., Babes, B., & Chaouch, S. (2022). Optimization of welding input parameters using PSO technique for minimizing HAZ width in GMAW. Periodica Polytechnica Mechanical Engineering, 66(2), 99–108. https://doi.org/10.3311/PPME.14127
- Xiao, J., Wang, X., Gai, S., Chen, S., & Huang, W. (2023). Effect of mechanical stirring on high-speed GMAW hump bead. Materials, 16(12), 4493. https://doi.org/10.3390/ma16124493
- Pawlik, J., Cieślik, J., Bembenek, M., Góral, T., Kapayeva, S., & Kapkenova, M. (2022). On the influence of linear energy/heat input coefficient on hardness and weld bead geometry in chromium-rich stringer GMAW coatings. Materials, 15(17), 6019. https://doi.org/10.3390/ma15176019
- Santhakumari, A., Senthilkumar, T., Ramasamy, N., & Mahadevan, G. (2024). Influence of controlled and conventional short circuit waveforms on mechanical and microstructural effects in the gas metal arc welding processes. Case Studies in Thermal Engineering, 55, 104056. https://doi.org/10.1016/j.csite.2024.104056
- Yang, K., Wang, F., Duan, D., Xia, B., Luo, C., Yu, Z., Li, W., Yang, L., & Li, H. (2021). Prediction of HAZ microstructure and hardness for Q960E joints welded by triple-wire GMAW based on thermal and numerical simulation. Materials, 14(17), 4898. https://doi.org/10.3390/ma14174898
- Liu, D., Yang, J., Zhang, Y., Qiu, Y., Cheng, G., & Yao, M. (2021). Effect of welding heat input on the microstructure and impact toughness of HAZ in 420 MPa-grade offshore engineering steel. Frontiers in Materials, 8, 694586. https://doi.org/10.3389/fmats.2021.694586
- Molina-Castillo, A. E., López-Baltazar, E. A., Alvarado-Hernández, F., Gómez-Jiménez, S., Espinosa-Lumbreras, J. R., Jorge, J., Mondragón, R., & Baltazar-Hernández, V. H. (2025). Effect of the heat affected zone hardness reduction on the tensile properties of GMAW press hardening automotive steel. Metals, 15, 791. https://doi.org/10.3390/met15070791
- Kumar, V., Yadav, S. K., Vijetha, K., Mendhe, V., Kumari, A., Shrivastava, V., Goga, G., & Jain, A. (2025). An investigation of the effect of GMAW and SMAW processes on mechanical and microstructural properties of welded E350 grade steel. Scientific Reports, 15(1), 36338. https://doi.org/10.1038/s41598-025-20140-4
- American Welding Society. (2025). AWS D1.1/D1.1M:2025: Structural welding code—Steel. American Welding Society.
- Hu, Y., & Xue, J. (2023). Effects of flowrate of additional shielding gas on the properties of welded seam using twin-wire GMAW welding for duplex stainless steel. Metals, 13, 1224. https://doi.org/10.3390/met13071224
- Tashiro, S., Trinh, N. Q., Suga, T., Matsuda, N., Tsurumaru, N., Maeda, T., Tanaka, R., Nakatsu, S., Tsujii, G., Bui, H. V., & Tanaka, M. (2021). Influence of cross-wind on CO₂ arc welding of carbon steel. Metals, 11, 1677. https://doi.org/10.3390/met11111677
- British Standards Institution. (2009). BS EN 1011-1:2009: Welding—Recommendations for welding of metallic materials—Part 1: General guidance for arc welding. British Standards Institution.
- Lakhdari, M. A., Krajcarz, F., Mithieux, J. D., & Van Landeghem, H. P. (2021). Strength enhancement of superduplex stainless steel using thermomechanical processing. Metals, 11(7), 1094. https://doi.org/10.3390/met11071094
- Roshan, R., Naik, A. K., Saxena, K. K., Singh, K., Shajan, N., Msomi, V., & Mehdi, H. (2023). Effect of welding speed and wire feed rate on arc characteristics, weld bead and microstructure in standard and pulsed gas metal arc welding. Journal of Adhesion Science and Technology, 37(23), 3297–3314. https://doi.org/10.1080/01694243.2023.2192314
- Dagostini, S., De Moura, A. N., & Luz, T. D. S. (2021). Microstructural analysis and mechanical behavior of the HAZ in an API 5L X70 steel welded by GMAW process. Welding in the World, 65, 1051–1060. https://doi.org/10.1007/s40194-021-01102-6
- Xiao, N., Kong, H., Sun, Q., & Ma, N. (2024). Study of process, microstructure, and properties of double-wire narrow-gap gas metal arc welding low-alloy steel. Materials, 17(24), 6183. https://doi.org/10.3390/ma17246183
- Sankar, N., Malarvizhi, S., & Balasubramanian, V. (2021). Mechanical properties and microstructural characteristics of rotating arc-gas metal arc welded carbon steel joints. Journal of Mechanical Behavior of Materials, 30(1), 49–58. https://doi.org/10.1515/jmbm-2021-0006
- Amin, S. A., Marhoon, I. I., Abd, D., Noori, A., Eleiwi, M. A., Majdi, H. S., & Habeeb, L. J. (2025). Mathematical modelling of engineering problems: Experimental and numerical investigation of heat input effects in gas metal arc welding and shielded metal arc welding: A detailed comparison of welded alloy steel properties. Mathematical Modelling of Engineering Problems, 12(7), 2351–2361. https://doi.org/10.18280/mmep.120715
- Kadir, H., & Saragih, A. D. (2024). The effect of heat input on tensile strength, Vickers hardness, and microstructure on DMW of AISI 1015 and 304L SS through the GMAW process. Journal of Achievements in Materials and Manufacturing Engineering, 123(1), 5–16. https://doi.org/10.5604/01.3001.0054.4920
- Dekis, M., Tawfik, M., Egiza, M., & Dewidar, M. (2025). Unveiling the characteristics of ER70S-6 low carbon steel alloy produced by wire arc additive manufacturing at different travel speeds. Metals and Materials International, 31(2), 325–338. https://doi.org/10.1007/s12540-024-01766-x
Conflict of Interest Statement
The authors declare no conflict of interest.
Author Contributions
Data Availability Statement
All relevant data are included within the article.
Supplementary Materials
There are no supplementary materials to include.