Received: May 25, 2026 Accepted: Sep 09, 2026 Available Online: Sep 21, 2026
DOI: 10.5937/jaes0-67548
MECHANICAL AND MICROSTRUCTURAL BEHAVIOR OF COLLOIDAL NANO-SILICA MODIFIED PUMICE LIGHTWEIGHT CONCRETE UNDER FREEZE–THAW CYCLES
Abstract
This study investigated the mechanical and microstructural behavior of colloidal nano-silica modified pumice lightweight concrete under freeze–thaw cycles. In the study, the control mixture (REF) and the mixture containing 5% nano-silica (NS5), which previously exhibited the most balanced performance under normal curing conditions, were comparatively evaluated. Freeze–thaw behavior was investigated using separate specimen series having the same mixture proportions. Compressive strength and ultrasonic pulse velocity (UPV) tests were performed to evaluate the mechanical performance, while microstructural changes were investigated through SEM, EDS, XRD, and FTIR analyses. The results showed that nano-silica contributed to matrix densification, promoted additional C-S-H formation, and improved the mechanical performance under normal curing conditions. However, after freeze–thaw cycles, microcrack development, UPV reduction, and strength loss were observed, particularly in the denser microstructures. The restricted dissipation of internal hydraulic pressure is considered a possible explanation for this behavior rather than a directly demonstrated mechanism. The combined evaluation of FTIR, XRD, SEM, and EDS results indicated that freeze–thaw exposure may cause partial structural disorder and microstructural deterioration within the dense C-S-H network.
Highlights
- Colloidal nano-silica improved the matrix densification of pumice concrete.
- Freeze–thaw exposure resulted in different damage responses depending on microstructural development.
- SEM–EDS–XRD–FTIR analyses revealed changes in the C-S-H structure.
- Restricted internal pressure dissipation may be a possible factor affecting freeze–thaw behavior.
Keywords
Content
1 Introduction
Pumice aggregate lightweight concretes are widely preferred in the construction industry due to their low unit weight, improved thermal insulation properties, and contribution to reducing seismic loads. The highly porous structure of pumice aggregate provides significant advantages in terms of reduced density and thermal performance in lightweight concrete systems. However, the freeze–thaw behavior of lightweight concretes is governed not only by the total void content but also by complex mechanisms related to pore structure, pore distribution, water absorption capacity, and internal pressure development. In particular, variations in the pore structure may influence the dissipation of internal hydraulic pressure generated during freezing, thereby significantly affecting the durability performance of concrete [1,2,3,4,5].
In recent years, the use of nano-sized pozzolanic materials to improve the mechanical and microstructural properties of cement-based composites has increased considerably. Among these materials, nano-silica has attracted significant attention due to its high specific surface area, small particle size, and strong pozzolanic reactivity. Nano-silica accelerates the consumption of calcium hydroxide (CH) and promotes the formation of additional calcium silicate hydrate (C-S-H) gel, thereby contributing to matrix densification and improvement of the interfacial transition zone (ITZ). Previous studies have reported that nano-silica incorporation can improve compressive strength, reduce permeability, and refine the pore structure of cementitious materials [6,7,8,9,10,11,12].
In the authors’ previous study, the effects of different colloidal nano-silica contents on the mechanical and microstructural properties of pumice lightweight concretes were investigated under normal curing conditions. The results demonstrated that the NS5 mixture exhibited the most balanced performance in terms of compressive strength development, matrix densification, and microstructural integrity [13]. The dense matrix structure and improved microstructure produced by nano-silica positively influenced the mechanical performance under normal curing conditions. However, the behavior of this dense microstructure under freeze–thaw exposure has not yet been fully clarified.
During freeze–thaw cycles, the transformation of pore water into ice may lead to the development of internal hydraulic pressure within the concrete matrix. In particular, changes in pore structure and reductions in free void volume may increase internal pressure during freezing, thereby accelerating the development of microcracks. Several studies have reported that high nano-silica contents may influence pore evolution and microstructural damage under freeze–thaw cycles. Therefore, the dense matrix structure that improves mechanical performance under normal curing conditions may not always provide superior freeze–thaw durability in porous lightweight concrete systems [14,15,16,17].
Although numerous studies have investigated the freeze–thaw behavior of nano-silica modified concretes, most of these studies have focused on normal-weight concrete systems. Previous studies have also indicated that the influence of nano-silica on freeze–thaw behavior may vary depending on nano-silica content, pore structure, and microstructural changes. Nevertheless, studies investigating the mechanical and microstructural behavior of colloidal nano-silica modified pumice lightweight concretes under freeze–thaw exposure using multiple characterization techniques remain limited. In particular, further studies are required to comprehensively evaluate the relationship between microcrack development, phase transformations, chemical deterioration mechanisms, and mechanical performance [14,15,16,17].
Nano-silica contributes to matrix densification by improving the pore structure and promoting additional C-S-H formation. However, particularly in porous lightweight concrete systems, excessively densified microstructures may hinder the dissipation of internal hydraulic pressure generated during freeze–thaw cycles. Despite the dense matrix structure, this condition may lead to the development of microstructural discontinuities and partial deterioration within the C-S-H network, thereby adversely affecting durability performance.
Therefore, the present study investigated the mechanical and microstructural behavior of colloidal nano-silica modified pumice lightweight concretes under freeze–thaw cycles. The primary motivation of the study was to evaluate the freeze–thaw performance of the NS5 mixture, which previously exhibited the most balanced mechanical and microstructural performance under normal curing conditions. In this context, only the control mixture (REF) and the NS5 mixture were selected for durability evaluation. Freeze–thaw behavior was comparatively investigated using separate specimen series having identical mixture proportions. To evaluate freeze–thaw induced deterioration mechanisms at both macro and micro scales, compressive strength and ultrasonic pulse velocity (UPV) tests were performed together with SEM, XRD, FTIR, and EDS analyses.
2 Materials and methods
2.1 Materials
In this study, CEM I 42.5 R Portland cement conforming to TS EN 197-1 [18] was used as the binder material. Potable water complying with TS EN 1008 [19] was used as mixing water. Pumice aggregate obtained from the Sarıkamış region of Türkiye was used as lightweight aggregate. The maximum aggregate particle size was 8 mm. An image of the Sarıkamış (Türkiye) pumice aggregate used in the study is presented in Fig. 1.
The colloidal nano-silica used in this study was commercially supplied by Silika Kimya (Konya, Türkiye). The product consisted of a colloidal nano-silica suspension containing approximately 30% solid SiO₂ and 70% water dispersed in water. The main physical and chemical properties provided by the manufacturer are summarized in Table 1.
In the previous study, nano-silica suspension was incorporated into the mixtures at rates of 0%, 1%, 2%, 3%, 4%, 5%, and 6% by cement weight. These ratios correspond to the mass of the colloidal nano-silica suspension. Accordingly, the effective solid nano-silica content corresponded to approximately 0–1.8% by cement weight. In the present freeze–thaw study, the control mixture (REF) and the mixture containing 5% colloidal nano-silica suspension (NS5), which exhibited the most balanced mechanical and microstructural performance in the previous study [13], were selected.
The water contained in the nano-silica suspension was subtracted from the total mixing water to maintain a constant effective water/cement ratio of 0.54 in all mixtures. In addition, the aggregate content was reduced to compensate for the added nano-silica suspension and to maintain a constant total mixture volume. Detailed material properties and the general mixture design approach were based on the authors’ previous study [13].
Table 1. Physical and chemical properties of the colloidal nano-silica
|
Property |
Unit |
Value |
|
SiO₂ content (solid) |
wt% |
30 |
|
Water content |
wt% |
70 |
|
pH |
- |
9.0 |
|
Density |
g/mL |
1.20 |
|
Viscosity (25 °C) |
cps |
≤ 8 |
|
Specific surface area |
m²/g |
~200 |
|
Na₂O content |
wt% |
< 0.5 |
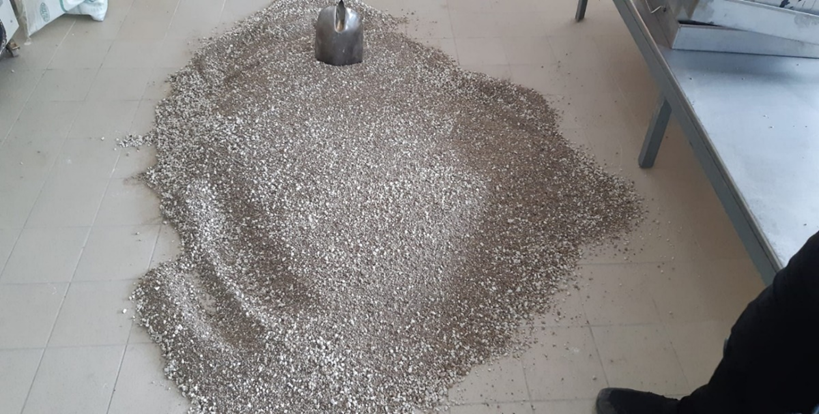
Fig. 1. Sarıkamış (Türkiye) pumice aggregate used in the study
2.2 Physical properties of pumice aggregate
The pumice aggregate was divided into three particle size fractions: 0–2 mm, 2–4 mm, and 4–8 mm. To achieve continuous gradation in the concrete mixtures, these fractions were used at ratios of 30%, 50%, and 20%, respectively. The same aggregate gradation was maintained in all mixtures to more accurately evaluate the effect of nano-silica incorporation.
Physical properties of the pumice aggregate, including specific gravity, water absorption, and particle density, were determined in accordance with the relevant standards. Due to the porous structure and high water absorption capacity of the pumice aggregate, these properties were taken into consideration during the mixture design process.
2.3 Mixture proportions
In this study, the control mixture (REF) and the NS5 mixture containing 5% colloidal nano-silica suspension were used. The colloidal nano-silica suspension contained approximately 30% solid SiO₂ and 70% water. The NS5 mixture was selected because it exhibited the most balanced mechanical and microstructural performance under normal curing conditions in the authors’ previous study [13].
During the mixture design process, the water contained in the nano-silica suspension was deducted from the total mixing water to maintain a constant effective water/cement ratio. An effective water/cement ratio of 0.54 was maintained for all mixtures. Furthermore, the aggregate content was reduced to compensate for the added nano-silica suspension and to maintain a constant total mixture volume. The mixture design approach was based on the authors’ previous study [13].
To ensure continuous gradation, the pumice aggregate was used in 0–2 mm, 2–4 mm, and 4–8 mm fractions at ratios of 30%, 50%, and 20%, respectively. Detailed mixture proportions are presented in Table 2.
Table 2. REF: Control mixture; NS5: Mixture containing 5% colloidal nano-silica suspension by cement weight. The water contained in the nano-silica suspension was deducted from the total mixing water, and the aggregate content was reduced to maintain a constant total mixture volume. Mixture proportions were adopted from the authors’ previous study [13]
|
Component (kg/m³) |
REF |
NS5 |
|
Water/Cement Ratio |
0.54 |
0.54 |
|
Cement |
370 |
370 |
|
Effective Water |
199 |
186 |
|
0–2 mm Aggregate |
240 |
234 |
|
2–4 mm Aggregate |
399 |
390 |
|
4–8 mm Aggregate |
160 |
156 |
|
Solid Nano-Silica |
0 |
5.55 |
|
Colloidal Nano-Silica Suspension |
0 |
13 |
2.4 Specimen preparation and freeze–thaw conditions
Concrete mixtures were prepared using a laboratory-type mechanical mixer. Fresh concrete mixtures were cast into 50 × 50 × 50 mm steel cube molds. Since the maximum aggregate particle size was 8 mm, the selected specimen dimensions were considered sufficient to provide an appropriate aggregate/specimen ratio. The specimens were compacted in accordance with TS EN 12390-2 [20]. After demolding, the specimens were cured in water at 20 ± 2 °C following the initial 24 h period.
The specimens used in the present freeze–thaw study were newly produced specifically for this experimental programme and were not the specimens used in the authors’ previous study [13]. However, the same mixture proportions and preparation procedure reported in the previous study [13] were adopted. After demolding, the specimens were stored under water-curing conditions at 20 ± 2 °C until the designated freeze–thaw exposure ages. One group was removed from water curing after 7 days, while the other group was removed after 28 days and subsequently subjected to the freeze–thaw procedure.
A modified laboratory freeze–thaw procedure based on the fundamental principles of ASTM C666 was applied. The specimens were in a water-saturated condition before the freeze–thaw exposure. Each cycle consisted of approximately 12 h of freezing at −18 °C followed by approximately 12 h of thawing in water at +4 °C. The freezing and thawing temperatures were monitored using a thermometer throughout the procedure. A total of 30 freeze–thaw cycles were selected as a defined laboratory exposure level for the comparative evaluation of REF and NS5 mixtures. Since each cycle in the modified procedure lasted approximately 24 h, the selected exposure corresponded to approximately 30 days of continuous freeze–thaw testing.
After completion of the freeze–thaw exposure, the 7-day curing group was maintained under the same curing conditions until the 28-day curing group completed its freeze–thaw cycles. Consequently, all specimens were tested at approximately 58 days of age.
Three specimens were used for each mixture, curing period, and experimental group, and the test results were evaluated based on the average values obtained from the specimens.
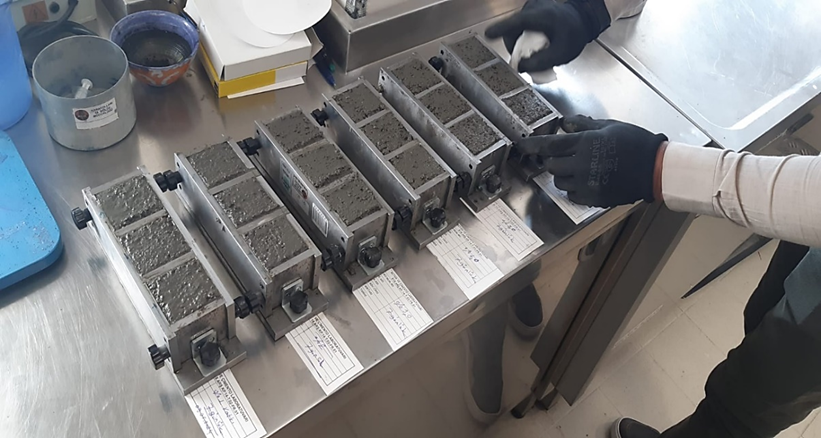
Fig. 2. Preparation of concrete specimens and placement into steel molds
2.5 Experimental methods
2.5.1 Compressive strength test
Compressive strength tests were conducted in accordance with TS EN 12390-3 [22]. Cube specimens with dimensions of 50 × 50 × 50 mm were placed in the testing machine such that the loading direction was perpendicular to the casting direction. The load was continuously applied at a loading rate of approximately 0.6 MPa/s until failure occurred.
Three specimens (n = 3) were tested for each mixture, curing period, and experimental group, and the compressive strength values were calculated as the arithmetic mean of the three results. Since all specimens were comparatively evaluated under identical conditions, no size conversion factor was applied in this study.
2.5.2 Ultrasonic pulse velocity (UPV) test
Ultrasonic pulse velocity (UPV) measurements were performed in accordance with TS EN 12504-4 [23] using a Proceq Pundit UPV device equipped with 54 kHz transducers at the Faculty of Engineering Laboratory of Iğdır University. Measurements were conducted by direct transmission through two opposite faces of the cube specimens. Ultrasonic coupling gel was applied to both contact surfaces to ensure adequate coupling between the transducers and the concrete surface. UPV measurements were performed after completion of the 30 freeze–thaw cycles and prior to the compressive strength tests, and the pulse velocity values were directly obtained from the device.
Three specimens (n = 3) were tested for each mixture, curing period, and experimental group, and the average values of the obtained results were used. The UPV results were used to comparatively evaluate possible internal structural deterioration and microcrack development associated with freeze–thaw exposure.
2.5.3 Microstructural analyses
SEM, XRD, FTIR, and EDS analyses were conducted to investigate the effects of freeze–thaw exposure on the microstructure of the concrete. The microstructural analyses were performed on both the reference-cured and freeze–thaw exposed REF and NS5 specimens.
X-ray diffraction (XRD) analyses were conducted using a Rigaku-D/Max 2200 XRD device located at the Scientific and Technological Research Center of İnönü University. To minimize the influence of surface carbonation, crushed powder samples obtained from the interior regions of the specimens were used in the analyses. The specimens were scanned within an approximate 2θ range of 5°–80° to identify the major crystalline phases and hydration products.
Scanning electron microscopy (SEM) and energy-dispersive X-ray spectroscopy (EDS) analyses were carried out using a Zeiss SEM device located at the Science Application and Research Center of Van Yüzüncü Yıl University. The analyses were performed on fractured pieces obtained from the interior regions of the specimens. Prior to the analyses, the specimens were dried and coated with a thin conductive layer to improve image quality. Examinations performed at different magnifications were used to evaluate cement matrix morphology, matrix densification, microcrack formation, and aggregate–matrix interfacial transition zones. EDS analyses were used to investigate elemental distributions and variations in the Ca/Si ratio.
FTIR analyses were conducted using a Thermo Scientific Nicolet iS10 FT-IR Spectrometer located at the Science Application and Research Center of Van Yüzüncü Yıl University. The analyses were performed to identify the main chemical bonds associated with hydration products, and the spectra were recorded within the approximate wavenumber range of 4000–500 cm⁻¹.
The microstructural analysis results were interpreted collectively to comprehensively evaluate the effects of freeze–thaw exposure on the mechanical behavior and internal structural integrity of the concrete.
EDS analyses were performed simultaneously with the SEM examinations on the same analyzed regions of the fractured specimens. The Ca and Si contents were obtained from these regions, and the corresponding Ca/Si ratios were calculated from the EDS weight percentages.
3 Results and discussion
3.1 Compressive strength and ultrasonic pulse velocity (UPV) results
The compressive strength and ultrasonic pulse velocity (UPV) results of the REF and NS5 mixtures are presented in Table 3. To evaluate freeze–thaw behavior, specimens prepared with identical mixture proportions but produced as separate experimental series were comparatively evaluated. The 56-day reference values under normal curing conditions were obtained from the authors’ previous study [13]. In the present study, one group of specimens was subjected to freeze–thaw cycles after 7 days of curing, whereas the other group was exposed to freeze–thaw cycles after 28 days of curing.
Table 3. Compressive strength and UPV results
|
Mixture |
Experimental group |
Compressive strength (MPa) |
UPV (km/s) |
|
REF |
56-day normal curing [13] |
27.34 ± 0.13 |
– |
|
REF |
7-day curing + F-T |
26.42 ± 0.13 |
3.524 ± 0.005 |
|
REF |
28-day curing + F-T |
24.57 ± 0.36 |
3.472 ± 0.006 |
|
NS5 |
56-day normal curing [13] |
39.68 ± 0.21 |
– |
|
NS5 |
7-day curing + F–T |
33.57 ± 0.42 |
3.653 ± 0.004 |
|
NS5 |
28-day curing + F–T |
32.01 ± 0.12 |
3.595 ± 0.004 |
As shown in Table 3, both REF and NS5 mixtures subjected to freeze–thaw cycles exhibited lower compressive strength values compared to the reference specimens cured under normal conditions. Nevertheless, the NS5 mixture showed higher strength values than the REF mixture in all experimental groups. This behavior can be attributed to the densification of the cement matrix and the enhancement of hydration products promoted by colloidal nano-silica incorporation.
However, significant strength losses were observed in the NS5 mixture after freeze–thaw exposure. While the 56-day compressive strength of the NS5 mixture under normal curing conditions was 39.68 MPa, this value decreased to 33.57 MPa in the series exposed to freeze–thaw cycles after 7 days of curing and to 32.01 MPa in the series exposed after 28 days of curing. Similar strength reductions were also observed in the REF mixture.
The obtained results revealed that the series exposed to freeze–thaw cycles after 7 days of curing exhibited higher strength values than the series exposed after 28 days of curing. This trend was similarly observed in both REF and NS5 mixtures. The observed differences between the two curing groups may be associated with several factors, including differences in hydration degree, curing history, and microstructural development. Although the denser microstructure developed with prolonged curing may have influenced the freeze–thaw response, it should be considered only as one possible contributing factor rather than the sole explanation for the observed differences.
The UPV results exhibited trends consistent with the compressive strength results. The reduction in UPV values in the freeze–thaw exposed series may be associated with internal structural discontinuities and microcrack development within the concrete. In particular, the lower UPV values obtained in the series exposed to freeze–thaw cycles after 28 days of curing indicated that denser microstructures may develop greater internal damage under freeze–thaw conditions.
Nevertheless, the NS5 mixture exhibited higher UPV values than the REF mixture in all freeze–thaw groups. This behavior indicates that nano-silica improved matrix densification and the aggregate–matrix interfacial transition zone. However, the dense microstructure formed by nano-silica incorporation did not always provide superior freeze–thaw durability. These findings indicate that although nano-silica improves mechanical performance under normal curing conditions, freeze–thaw behavior in porous lightweight concrete systems cannot be explained solely by strength enhancement.
3.2 SEM-EDS analysis results
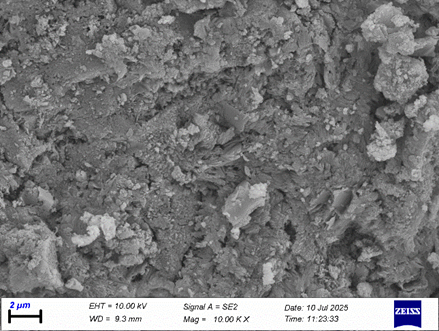
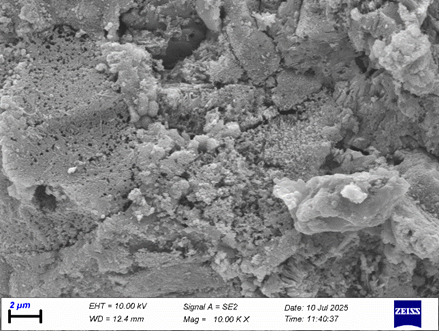
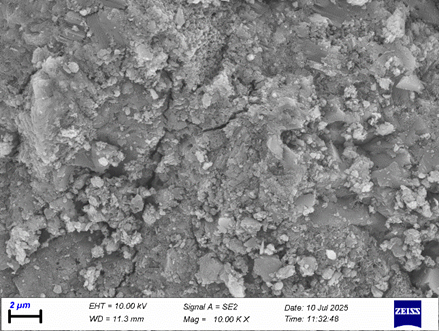
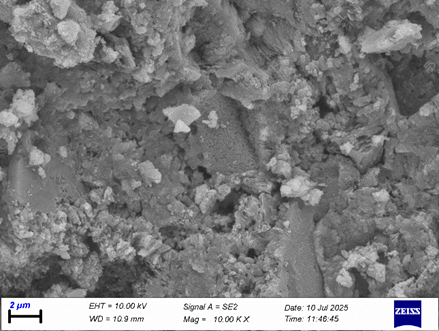
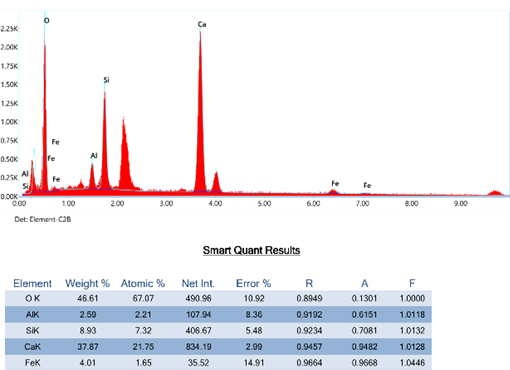
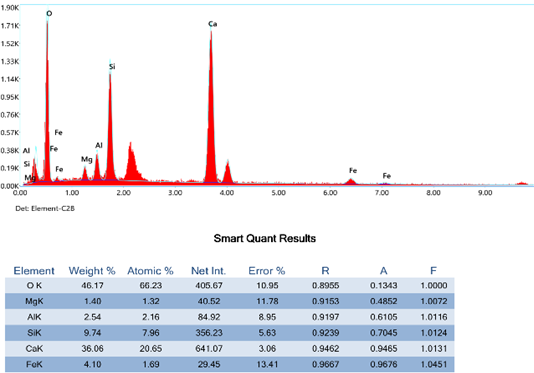
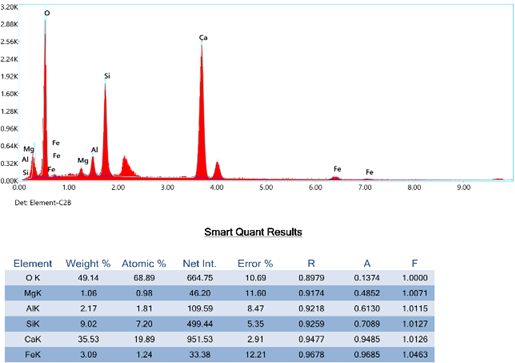
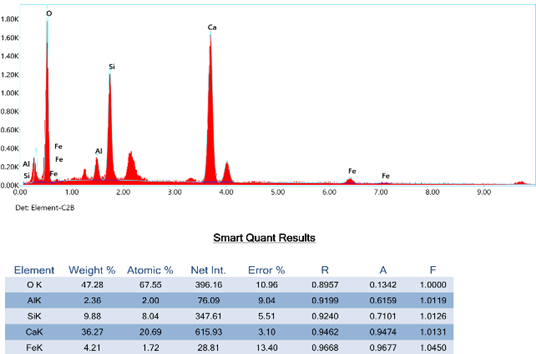
SEM images of the REF and NS5 series exposed to freeze–thaw cycles are presented in Fig. 3, while the EDS analysis results are shown in Fig. 4. The microstructural evaluations were interpreted together with the compressive strength and UPV results to achieve a more comprehensive understanding of freeze–thaw induced internal damage mechanisms.
The SEM images of the 7-day REF series revealed a relatively loose and heterogeneous cement matrix. Local microvoids, matrix discontinuities, and irregular hydration regions were observed. However, since the structure was not fully densified, it was considered to contain a more open pore system. The relatively open microstructural features observed in this series may have influenced its freeze–thaw response; however, the associated internal pressure dissipation was not directly measured.
In the SEM images of the 28-day REF series, denser hydration products and more compact matrix regions were observed. However, microstructural discontinuities and localized separations throughout the matrix became more pronounced after freeze–thaw exposure. The denser microstructural features may have influenced the observed freeze–thaw response; however, restricted internal hydraulic pressure dissipation should be considered only as a possible explanation, since internal pressure was not directly measured This observation is consistent with the lower compressive strength and UPV results obtained for the 28-day REF series.
Compared to the REF series, the SEM images of the NS5 series exhibited a denser and more homogeneous microstructure. Particularly in the 7-day NS5 series, the additional C-S-H gel formed by the pozzolanic effect of nano-silica appeared to partially fill the pore structure and improve matrix continuity. Accordingly, the NS5 series exhibited higher compressive strength and higher UPV values than the REF series.
Nevertheless, although the SEM images of the 28-day NS5 series showed a highly compact matrix structure with low-void regions, interconnected microstructural discontinuities and localized separations were also observed. These observations suggest that the dense microstructure produced by nano-silica incorporation did not prevent microstructural damage during freeze–thaw exposure. Restricted stress or internal pressure dissipation may be considered as a possible explanation for this behavior; however, these parameters were not directly measured in the present study.
|
a) |
b) |
|
c) |
d) |
Fig. 3. SEM images of REF and NS5 mixtures after freeze–thaw exposure: (a) REF-7FT, (b) REF-28FT, (c) NS5-7FT, and (d) NS5-28FT
The EDS analysis provided quantitative information on the elemental composition of the regions examined by SEM (Fig. 4). The Ca and Si contents were 37.87 and 8.93 wt.% for REF-7FT, 36.06 and 9.74 wt.% for REF-28FT, 35.53 and 9.02 wt.% for NS5-7FT, and 36.27 and 9.88 wt.% for NS5-28FT, respectively. The corresponding Ca/Si ratios, calculated from the EDS weight percentages, were 4.24, 3.70, 3.94, and 3.67, respectively. These local EDS results indicate compositional differences among the analyzed regions; however, they should be interpreted as site-specific measurements rather than as representative of the entire specimen.
 |
 |
|
a) |
b) |
|
c) |
d) |
Fig. 4. EDS spectra of REF and NS5 mixtures after freeze–thaw exposure: (a) REF-7FT, (b) REF-28FT, (c) NS5-7FT, and (d) NS5-28FT
When the SEM and EDS results are evaluated together, differences in microstructural features and local elemental composition can be observed between the REF and NS5 mixtures after freeze–thaw exposure. These observations, together with the mechanical and UPV results, suggest that the freeze–thaw response may be influenced by differences in microstructural development. However, since pore structure, degree of saturation, and internal hydraulic pressure were not directly measured, the possible influence of these factors should be considered as an interpretation rather than a demonstrated mechanism.
3.3 XRD analysis results
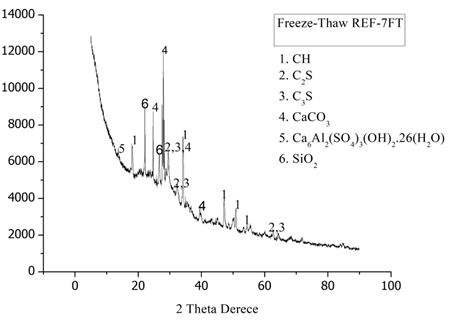
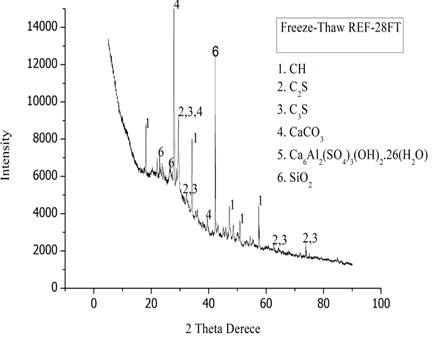
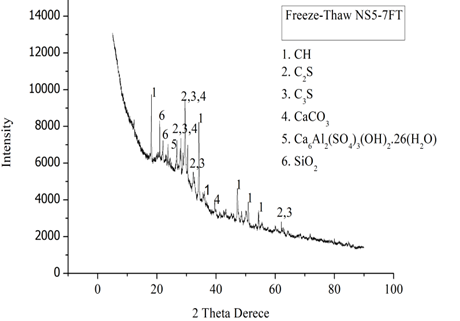
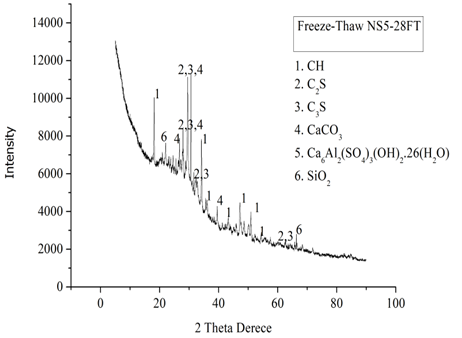
The XRD patterns of the REF-7FT, REF-28FT, NS5-7FT, and NS5-28FT mixtures exposed to freeze–thaw conditions are presented in Fig. 5. The analyses identified the major phases including calcium hydroxide (CH), dicalcium silicate (C₂S), tricalcium silicate (C₃S), calcite (CaCO₃), ettringite, and quartz (SiO₂).
|
a) |
b) |
|
c) |
d) |
Fig. 5. XRD patterns of (a) REF-7FT, (b) REF-28FT, (c) NS5-7FT, and (d) NS5-28FT mixtures after freeze–thaw exposure
Distinct CH and CaCO₃ peaks were observed in the REF series. Differences in relative peak intensities were observed between REF-7FT and REF-28FT; however, because the XRD analysis was qualitative and no quantitative phase analysis was performed, these differences were not interpreted as direct evidence of changes in phase abundance or matrix densification. Nevertheless, the mechanical strength and UPV results demonstrated that the specimens exposed to freeze–thaw cycles after 28 days of curing exhibited greater deterioration than those exposed after 7 days of curing. Restricted internal hydraulic pressure dissipation may be considered as one possible explanation for this behavior; however, internal pressure and pore structure were not directly measured in the present study.
In the NS5 series, relatively lower CH peak intensities were observed compared to the REF mixtures. This result may be attributed to the pozzolanic activity of colloidal nano-silica, which increased CH consumption and promoted additional C-S-H formation. Furthermore, the broad amorphous region observed approximately between 20°–35° 2θ indicated an increase in hydration products and the formation of a denser cement matrix.
Among all mixtures, the NS5-28FT specimen exhibited the most pronounced compact hydration structure. This observation is consistent with the denser microstructure observed in the SEM images and the lower Ca/Si ratios determined by EDS analyses. The combined evaluation of SEM–EDS–XRD results indicates that nano-silica significantly modified the hydration mechanism and increased matrix densification.
However, the observed freeze–thaw response may have been influenced by differences in microstructural development. Restricted internal hydraulic pressure dissipation may be considered as one possible contributing factor; however, this mechanism was not directly measured in the present study.
3.4 FTIR analysis results
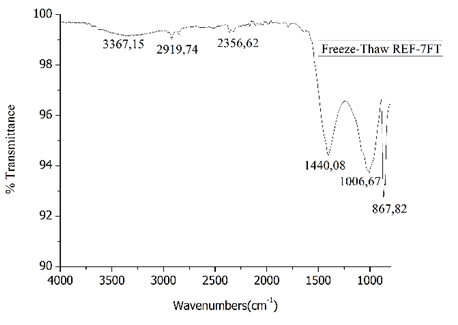
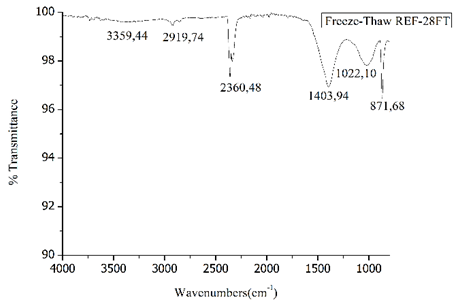
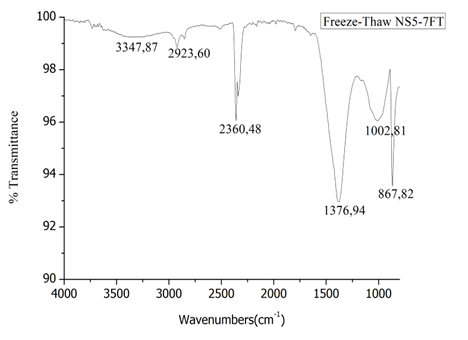
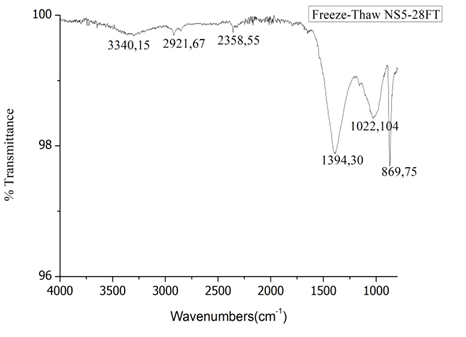
The FTIR spectra of the REF and NS5 series after freeze–thaw exposure are presented in Fig. 6. In all series, the band observed at approximately 3340–3367 cm⁻¹ was associated with O–H stretching vibrations and represented bound water within the hydration products. The shift of this band toward lower wavenumbers in the NS5 series indicated that nano-silica modified the structure of the hydration products and promoted the formation of a denser C-S-H structure.
The band observed at approximately 1400–1440 cm⁻¹ was associated with carbonate formations. Particularly in the NS5 series, the changes observed in this region indicated the influence of nano-silica on hydration reactions and carbonation behavior. These findings were consistent with the CaCO₃ phases identified in the XRD analyses.
The Si–O stretching vibration bands observed within the approximate range of 1000–1022 cm⁻¹ were associated with C-S-H gel formation. The more pronounced character of this band in the NS5 series indicated that nano-silica promoted additional C-S-H formation through pozzolanic reactions. However, the changes observed in the band structure after freeze–thaw exposure may also be associated with partial structural disorder and microstructural discontinuities within the dense C-S-H network. Previous studies have reported that freeze–thaw cycles may lead to density changes, microcrack formation, and structural instabilities within the C-S-H structure. When evaluated together with the denser matrix structure observed in SEM images, the lower Ca/Si ratios determined by EDS analyses, and the reductions observed in UPV results, these findings indicate that freeze–thaw exposure may cause internal structural damage development within densified cement matrices.
The bands observed within the range of 867–871 cm⁻¹ were associated with silicate- and carbonate-based hydration products. When considered together with the other results, the observed differences suggest that microstructural development may have influenced the response to freeze–thaw exposure. Restricted internal hydraulic pressure dissipation may be considered as a possible explanation for this behavior; however, pore structure, degree of saturation, and internal hydraulic pressure were not directly measured in the present study.
|
a) |
b) |
|
c) |
d) |
Fig. 6. FTIR spectra of REF and NS5 series exposed to freeze–thaw conditions: (a) REF-7FT, (b) REF-28FT, (c) NS5-7FT, and (d) NS5-28FT
4 Conclusions
The results showed that the NS5 mixture exhibited higher mechanical performance than the REF mixture after freeze–thaw exposure. The compressive strength values of the REF specimens were 26.42 and 24.57 MPa for the 7-day and 28-day curing groups, respectively, whereas the corresponding values for NS5 were 33.57 and 32.01 MPa. Similarly, the UPV values were higher for NS5 (3.653 and 3.595 km/s) than for REF (3.524 and 3.472 km/s). For both mixtures, the specimens exposed to freeze–thaw cycles after 7 days of curing exhibited higher compressive strength and UPV values than those exposed after 28 days of curing.
SEM observations revealed differences in matrix compactness and microstructural discontinuities among the investigated groups, while EDS analyses indicated local variations in Ca and Si contents and Ca/Si ratios. XRD and FTIR analyses further showed qualitative differences in hydration-related phases and bonding characteristics. Taken together, these observations indicate that the freeze–thaw response may be influenced by differences in curing history and microstructural development. Restricted internal hydraulic pressure dissipation may be considered as one possible contributing factor; however, pore structure, degree of saturation, and internal hydraulic pressure were not directly measured in the present study.
Overall, colloidal nano-silica incorporation provided higher mechanical performance than the REF mixture under the investigated freeze–thaw conditions. However, the findings of the present study are limited to the mechanical and microstructural behavior observed after 30 freeze–thaw cycles and should not be interpreted as representing long-term freeze–thaw durability or service-life performance.
Acknowledgements
This study was derived from the author’s doctoral dissertation.
References
- Yang, Y., Xiao, T., & Ming, X. (2024). Effect of nano-silica on the mechanical performance and porosity evolution of concrete under freezing and thawing cycles. Structural Concrete, 26(6), 2446–2466. https://doi.org/10.1002/suco.202400620
- Tuncer, M., Bideci, A., Bideci, Ö., Çomak, B., & Durmuş, G. (2025). Engineering properties and thermal conductivity of lightweight concrete with polyester-coated pumice aggregates. Science and Engineering of Composite Materials, 32(1), Article 20250057. https://doi.org/10.1515/secm-2025-0057
- Shafiq, M., Khan, F., Badrashi, Y., Khan, F., Fahim, M., Abbas, A., & Adil, W. (2021). Evaluation of mechanical properties of lightweight concrete with pumice aggregate. Advances in Science and Technology Research Journal, 15(2), 173–182. https://doi.org/10.12913/22998624/135198
- Bideci, Ö., Bideci, A., Ashour, A., & Khan, A. (2025). Acoustic, thermal, and mechanical performance of polymer-coated pumice aggregate lightweight concretes. Polymers, 17(24), Article 3248. https://doi.org/10.3390/polym17243248
- Özgüler, A., Göncüoğlu, T., & Emiroğlu, M. (2023). Investigation of water absorption and impact resistance performance of cement paste-coated pumice aggregates. International Journal of Pure and Applied Sciences, 9(1), 110–120. https://doi.org/10.29132/ijpas.1248073
- Ranjan, M., Kumar, S., & Sinha, S. (2024). Nanosilica’s influence on concrete hydration, microstructure, and durability: A review. Journal of Applied Engineering Sciences, 14(1), 322–335. https://doi.org/10.2478/jaes-2024-0040
- Peng, X., Wang, Q., & Wu, J. (2023). Effect of nanosilica on the strength and durability of cold-bonded fly ash aggregate concrete. Sustainability, 15(21), 15413. https://doi.org/10.3390/su152115413
- Nigam, M., & Verma, M. (2023). Effect of nano-silica on the fresh and mechanical properties of conventional concrete. Forces in Mechanics, 10, Article 100165. https://doi.org/10.1016/j.finmec.2022.100165
- Khan, K., Ahmad, W., Amin, M., & Nazar, S. (2022). Nano-silica-modified concrete: A bibliographic analysis and comprehensive review of material properties. Nanomaterials, 12(12), Article 1989. https://doi.org/10.3390/nano12121989
- Kashyap, V., Sancheti, G., Yadav, J., & Agrawal, U. (2023). Smart sustainable concrete: Enhancing the strength and durability with nano silica. Smart Construction and Sustainable Cities, 1, Article 11. https://doi.org/10.1007/s44268-023-00023-1
- Althoey, F., Zaid, O., Martínez-García, R., Alsharari, F., Ahmed, M., & Arbili, M. M. (2023). Impact of nano-silica on the hydration, strength, durability, and microstructural properties of concrete: A state-of-the-art review. Case Studies in Construction Materials, 18, e01997. https://doi.org/10.1016/j.cscm.2023.e01997
- Al-Saffar, F., Wong, L., & Paul, S. (2023). An elucidative review of the nanomaterial effect on the durability and calcium-silicate-hydrate (C-S-H) gel development of concrete. Gels, 9(8), Article 613. https://doi.org/10.3390/gels9080613
- Yildirim, S., & Gul, R. (2026). Effect of colloidal nano-silica on early- and later-age compressive strength and microstructure of pumice aggregate lightweight concrete. Journal of Composites Science, 10(4), Article 204. https://doi.org/10.3390/jcs10040204
- Mao, J., & Ayuta, K. (2008). Freeze-thaw resistance of lightweight concrete and aggregate at different freezing rates. Journal of Materials in Civil Engineering, 20(1), 78–84. https://doi.org/10.1061/(ASCE)0899-1561(2008)20:1(78)
- Lin, X., Wang, Y., Li, H., Zhao, Z., Zuo, H., Chen, D., & Hou, J. (2025). Microscopic mechanism of calcium silicate hydrate (C-S-H) freeze-thaw cycle based on molecular dynamics. Scientific Reports, 15. https://doi.org/10.1038/s41598-025-11739-8
- Khoshbakht, M., & Mohammadi, Y. (2018). An investigation of the effect of nano-silica on freeze and thaw using pumice in lightweight-concrete in sulfate environment [Doctoral dissertation, University of Mohaghegh Ardabili]. Irandoc.
- Al-Dikheeli, M., Thaib, H., & Alasadi, L. (2022). Mechanical properties and freeze-thaw resistance of lightweight aggregate concrete using artificial clay aggregate. Open Engineering, 12, 323–331. https://doi.org/10.1515/eng-2022-0019
- Turkish Standards Institute. (2012). TS EN 197-1: Cement—Part 1: Composition, specifications and conformity criteria for common cements. Turkish Standards Institute.
- Turkish Standards Institute. (2009). TS EN 1008: Mixing water for concrete—Specification for sampling, testing and assessing the suitability of water, including water recovered from processes in the concrete industry, as mixing water for concrete. Turkish Standards Institute.
- Turkish Standards Institute. (2019). Testing hardened concrete—Part 2: Making and curing specimens for strength tests (TS EN 12390-2). Turkish Standards Institute.
- ASTM International. (2015). Standard test method for resistance of concrete to rapid freezing and thawing (ASTM C666/C666M). ASTM International.
- Turkish Standards Institute. (2019). Testing hardened concrete—Part 3: Compressive strength of test specimens (TS EN 12390-3). Turkish Standards Institute.
- Turkish Standards Institute. (2012). Testing concrete—Part 4: Determination of ultrasonic pulse velocity (TS EN 12504-4). Turkish Standards Institute.
Conflict of Interest Statement
The author declares no conflict of interest.
Author Contributions
Data Availability Statement
The data supporting the findings of this study are available from the author upon reasonable request.
Supplementary Materials
No supplementary materials are available for this study.