Volume 24 number 1 article 1324 pages: 168-178
Received: Oct 22, 2025 Accepted: Jan 27, 2026 Available Online: Feb 26, 2026 Published: Mar 02, 2026
DOI: 10.5937/jaes0-62336
NUMERICAL STUDY OF DROPLET LENGTH AND BREAKUP TIME FOR GEOMETRY AND FLOW PARAMETERS IN A T-JUNCTION MICROFLUIDICS
Abstract
Droplet microfluidics finds its application in medical, chemical and biological research as well as in the field of medical device manufacturing. This paper studies the T-junction microfluidics and its parameters, such as droplet length and breakup time, as they vary with the channel width and phase velocities. The study reveals that droplet length rises with an increase in either of the channel width and time taken for breakup reduces and attains a steady value when dispersed phase width is increased. The droplets are smaller in size and form very quickly when the velocity of continuous phase is increased and vice versa. The study can be utilized as a part of a larger study of droplets and their particle encapsulations, and its utilization to generate more efficient and economical medical devices.
Highlights
- COMSOL study reveals the impact of channel width on droplet size and formation time.
- Phase velocity shifts droplet breakup characteristics.
- Flow velocity strongly governs droplet length and formation time.
- Level-set simulations accurately capture droplet and interface evolution in T-junctions.
Keywords
Content
1 Introduction
Droplet formation and propagation have wide applications in the medical and engineering fields. These include the preparation of a biomedical drug [1], targeted drug delivery [2] like targeting the cancer cells [3], food science [4], pesticide deposition [5], RT-PCR test for COVID-19 and DNA analysis [6]. The Microfluidics devices are the system designed for the generation, propagation and control of droplets of various sizes, ranging from micrometers to nanometers [7]. These system helps to control the droplet size more precise compared to macro systems [8]. Microfluidics, often referred to as "Lab-on-a-Chip," is valued for its ability to conduct experiments on a microscale using smaller quantities of raw materials and shorter reaction times [9]. The characteristics of droplets formed in microfluidic systems vary depending on flow properties (e.g., flow rate, velocity), geometry (e.g., channel width and thickness), and fluid properties (e.g., viscosity, surface tension) [10].
Droplets in microfluidics are formed using active and passive methods. External sources such as temperature, electric field and magnetic fields are used in the active method [11], while passive methods rely on geometrical variations to produce droplets. Co-flow, flow focusing, and crossflow [12] are the common passive methods widely employed in the studies. This paper focuses on the T-junction (a type of cross-flow), which is among the most used configurations due to its wide range of applications and ease of use.
The reduction in pressure across the emerging droplet triggers the droplet breakage at a T-junction. When a continuous phase fluid obstructs the flow of dispersed phase fluid flow the droplet breaks [13]. The size of the droplet formed decreases as continuous phase flow rate increases [14]. Depending on the change of regime the droplets can take on any shapes and regimes from spherical to plug shaped and from squeezing to the dripping regime.
Researchers have extensively studied the dynamics of droplet production, including the production rate's dependency on viscosity [15], the effects of inlet and outlet sizes on T-junction performance [16], and the dependency of droplet length on the flow rate ratio [17], among others. Studies have reported that increasing the channel size ratio decreases droplet production rates but increases droplet size, while higher viscosity ratios reduce droplet diameters [18]. Additionally, increasing the channel aspect ratio reduces droplet volume and increases droplet frequency [19]. Experimental methods for generating and studying droplet microfluidics are often expensive and time-consuming. This has driven researchers to use Computational Fluid Dynamics (CFD) to extend their work within shorter timeframes. Commercial software, such as ANSYS FLUENT and COMSOL, as well as open-source tools like OpenFOAM, are extensively used for such purposes [16].
An extensive literature study suggests the requirement to use the computational framework to find and optimize the droplet size and breakup time pattern. This framework can assist future researchers in advancing studies related to droplet coalescence, stability, and the ability of droplet propagation without breaking. This study utilizes Computational Fluid Dynamics (CFD) which significantly reducing the effort and time required for experimentation. It focuses on investigating droplet breakups and stable propagation, as well as the dependency of droplet size on geometry and flow parameters.
Recent studies have demonstrated continued progress in numerical and hybrid modeling of droplet formation in T-junction microfluidic devices. A recent work which performed on microfluidics numerically at low Weber and capillary numbers highlighted the sensitivity of droplet length to flow conditions and channel geometry which reinforced the importance of validated computational frameworks to predict parameters for microfluidic design [20]. There are emerging hybrid approaches in the recent studies that have combined simulations with machine learning models for quick and accurate prediction of droplet dynamics at low computational time. In a study of finite element method coupled with deep learning algorithms the computational cost was significantly reduced to determine the droplet length and formation regimes [21]. Moreover, data-driven models have shown strong potential to capture droplet dynamics such as droplet spreading behavior based on flow parameters and wettability effects for a wide range of parameters using supervised machine learning techniques [5].
Recent work has developed and experimentally validated a models for pressure-driven, on-demand droplet formation, highlighting the importance of linking interfacial forces, channel geometry, and operating conditions for robust microfluidic design [22]. A predictive model incorporating side-arm length and outlet-to-inlet width ratios to accurately determine critical capillary numbers for droplet breakup in T-junction microchannels was developed, highlighting the strong coupling between geometry and breakup behavior [23]. Present study adopts physics based validated numerical approach which can be used for integration with hybrid and machine learning models.
While classical studies have primarily focused on droplet size scaling and breakup regimes in T-junction microfluidics, the present work extends the analysis by systematically examining both droplet length and breakup time using a validated numerical framework with realistic fluid properties [13], [19]. There are many work based on droplet size study based on varying flow rate ratios but only few are based on geometrical variations and breakup time. The current study aims to understand the phenomenon of droplet size and its dependence on the width of the inlets. The influence of channel width and phase velocities on breakup dynamics is explicitly quantified, and simple predictive correlations relating droplet length to geometric ratios are proposed. These contributions improve the practical applicability of numerical modeling for microfluidic device design and provide a foundation for future studies on droplet-based particle encapsulation.
2 Materials and methods
2.1 Geometry
The computational domain used in the study is a two-dimensional T-junction as depicted schematically in Fig. 1.
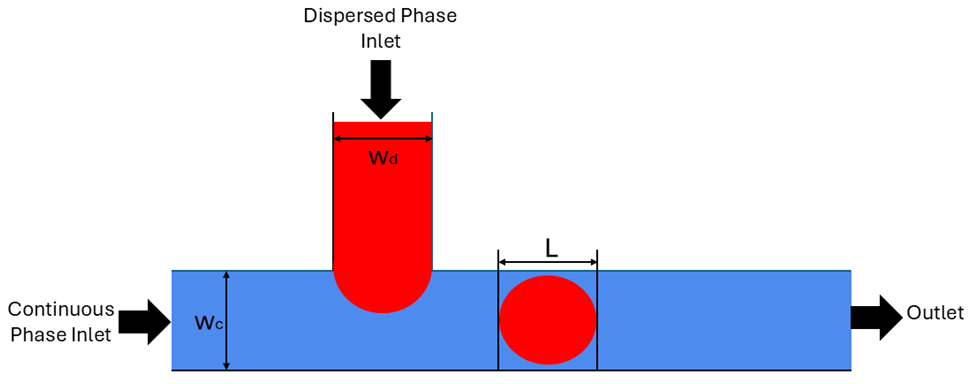
Fig. 1. An illustration of a droplet formed in a T-junction microfluidic device
The geometry consists of a side channel that introduces the dispersed phase fluid orthogonally into the main channel, while the main channel carries continuous phase fluid. Both channels are assumed to have rectangular cross-sections, which is consistent with commonly planned microfluidic devices. The width of the continuous phase channel is denoted as wc. In general, wc is represented as w in this work, since the main channel width is the same as the continuous phase channel width, while the width of the side (dispersed phase) channel is denoted as wd. The droplet length (L) is the distance between the two extreme ends of the droplet formed (Fig. 1). The lengths of the inlet and outlet channels are selected to be long enough to prevent backflow effects at the outlet and to maintain fully developed flow conditions upstream of the junction [24].
2.2 Boundary condition
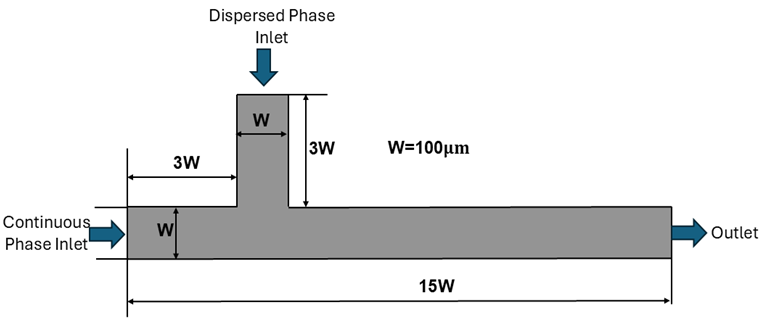
Computer simulations were carried out using COMSOL Multiphysics 6.2. A two-phase model and the Level Set method were used for simulations. The geometry and its dimensions are as shown in the Fig. 2a.
 |
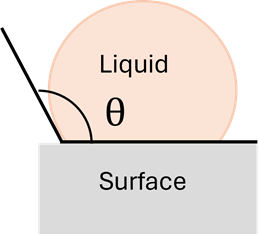 |
| Fig. 2a. Geometry & Boundary conditions for validation and mesh independence test | Fig. 2b. Contact angle on a microfluidic surface |
The working fluids used in the study are silicone oil as the continuous phase and aqueous glycerine solution as the dispersed phase. The parameters used in the study are as mentioned in Table 1 for both fluids. Uniform velocity inlet boundary conditions are applied at both the continuous and dispersed phase inlets, with inlet velocities varied to study their effect on droplet length and breakup time. A pressure outlet with zero-gauge pressure is imposed at the outlet. No-slip conditions are enforced at all channel walls. Wettability effects are incorporated by prescribing a constant static contact angle i.e., angle formed by the droplet (<90o hydrophilic, >90o hydrophobic, >150o superhydrophobic) on the microfluidic surface as shown in Fig. 2b at the walls through the Level Set formulation. Present wall lies in a hydrophobic condition with contact angle of 150o. Surface tension is included using a constant interfacial tension coefficient. The simulations assume incompressible, isothermal and laminar flow, with gravitational effects neglected due to their insignificance at the microscale.
Table 1. Parameters of fluids for the mesh independence test [25]
|
Description |
Values |
|
Viscosity of the Silicone Oil (Continuous phase) $\mu_c$ |
68.6 mPa-s |
|
Density of Silicone Oil $\rho_c$ |
0.984 g/cm3 |
|
Silicone oil velocity vc |
0.00347m/s |
|
Viscosity of aqueous glycerine solution (Dispersed phase) $\mu_d$ |
10.58 mPa-s |
|
Density of aqueous glycerine solution $\rho_d$ |
1.162 g/cm3 |
|
Aqueous glycerine solution velocity, vd |
0.00028 m/s |
|
Interfacial Tension γ |
12.5 mN/m |
|
Contact Angle θ |
150o |
2.3 Numerical method
The two-phase flow, which uses the Finite Element Method (FEM) in the T-junction microfluidic device, is modeled using the incompressible Navier–Stokes equations coupled with the Level Set method to capture the interface between the continuous and dispersed phases. In this formulation, a scalar level-set function is used to represent the fluid–fluid interface, which is advected by the local velocity field while being periodically reinitialized to maintain a smooth and well-defined interface. Viscosity and density values are considered to be constant throughout the experiment. The study uses the following numerical governing equations.
Continuity Equation
| $\nabla \cdot \mathbf{u} = 0$ | (1) |
where = velocity vector.
Momentum Equation (Navier–Stokes with Surface Tension)
| $\rho\left(\frac{\partial \mathbf{u}}{\partial t}+\mathbf{u}\cdot\nabla \mathbf{u}\right)=-\nabla p+\nabla\cdot\left[\mu\left(\nabla \mathbf{u}+(\nabla \mathbf{u})^{T}\right)\right]+\mathbf{F}_{st}$ | (2) |
Where $p$ is the pressure, $\rho$ is the density, $\mu$ is the dynamic viscosity and $\mathbf{F}_{st}$ is the surface tension force (defined below).
Surface Tension Force (Continuum Surface Force Model)
| $\mathbf{F}_{st}=\sigma \kappa \,\delta(\phi)\,\mathbf{n}$ | (3) |
with
| $\mathbf{n} = \frac{\nabla \phi}{|\nabla \phi|}, \quad \kappa = -\nabla \cdot \mathbf{n}$ | (4) |
where is interfacial tension, = interface curvature and = delta function localized at the interface
The capillary number (Ca) is defined as
|
$Ca = \frac{\mu_c U_c}{\sigma}$ |
(5) |
where is the dynamic viscosity of the continuous phase, is the characteristic velocity of the continuous phase and is the interfacial tension between the two phases. The capillary number represents the ratio of viscous forces to interfacial tension forces that act on the droplet. In this microfluidics, Ca governs the droplet formation and breakup dynamics. This parameter is kept constant throughout the experiment to study the effect of width variation.
The droplet length ratio (L/w) is defined as
| $L/w $ | (6) |
where is the droplet length measured along the main channel and is the width of the main (continuous phase) channel as shown in the Fig. 1 & Fig. 3d. This non-dimensional parameter characterizes the degree of geometric confinement experienced by the droplet within the microchannel. It reflects the balance between deformation and confinement effects, and it is used along with the Capillary number in scaling laws and validation studies.
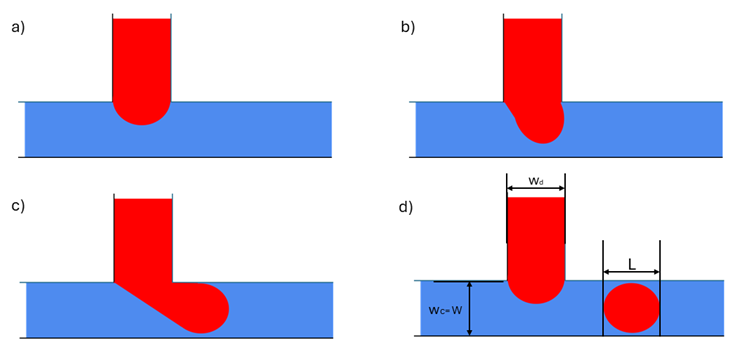
Fig. 3. Schematic illustration of Droplet formation in T-junction microfluidics
The interaction between parameters such as interfacial tension which prevents dispersed phase from deforming and viscous shear force imposed by continuous phase results in droplet formation in T junction. As the fluid enters the channel (Figs. 3a & 3b), the channel fills and blocks the cross-section causing the pressure to build upstream. In addition, interfacial tension occurs only at fluid-fluid interface and works to reduce the interfacial area which prevents the droplet deformation and neck thinning near the junction. As shown in Fig. 3c, the dispersed phase is simultaneously dragged downstream by viscous shear from the continuous phase, resulting in interface curvature and localized necking close to the junction. Droplet breakup occurs when the viscous stresses overcome the stabilizing interfacial tension forces, leading to pinch-off as shown in Fig. 3d. The numerical droplet formation is as shown in Fig. 4 for velocities of Vc=3.47mm/s and Vd=0.28mm/s for a constant capillary number (Ca~0.02).
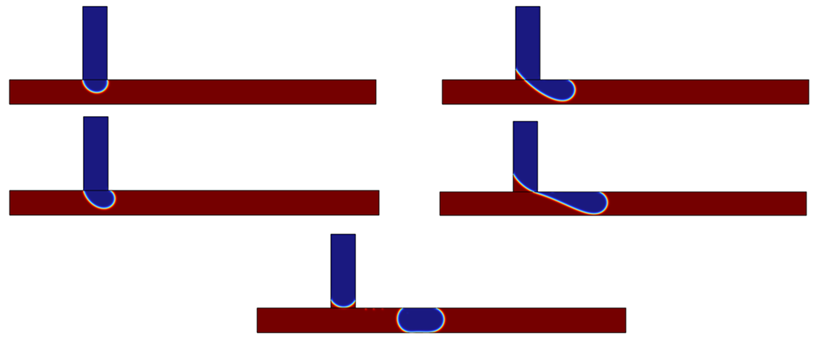
Fig. 4. Numerical droplet formation in a T junction
2.4 Mesh independence test and validation of the model
A mesh independence test was conducted to select an appropriate mesh size for the numerical study. The change in droplet length with mesh size was studied, where mesh sizes varied in the range of 5 µm to 1 µm. Droplet length was measured using ImageJ software and the results showed a gradual decrease in droplet length with an increasing mesh element size. It was observed that for mesh sizes of 1 µm and 2 µm, there was no appreciable change in droplet length. For further analysis, a mesh size of 2 µm was chosen to reduce computational time. A plot of these results is shown in the graph (Fig. 5).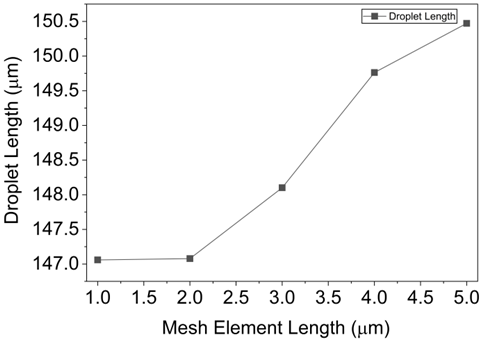
Fig. 5. Mesh independence test
As part of validating the model, the present study uses dimensionless parameters like the capillary number and length-to-width ratio (L/w). From the analysis, it is evident that the dimensionless parameter L/w, as a function of the capillary number, decreases with the increase in the capillary number. The observed pattern aligns with the findings of a previous experimental study [25] as shown in Fig. 6, further showing improvement in accuracy as the capillary number rises. The slight deviation in numerical and experimental values may have occurred from the variations in the physical properties of the experiment (variations of temperature, flow, channel roughness) [26]. The numerical 2D results are significant as they reduce the computational time and effort, with good numerical agreement with the experimental study. Therefore, it can be concluded that the suggested model can accurately predict droplet length over a range of parameters.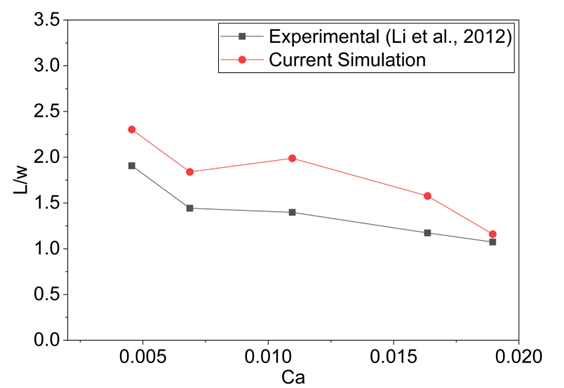
Fig. 6. Validation of the model with experimental work [25]
3 Results and discussion
The following section discusses the variation in droplet length and droplet formation time for different geometries and phase velocities.
3.1 Effect of Channel Width
Table 2. tabulates the effects of channel width on droplet length and droplet formation time, with all other parameters held constant. Droplet length was measured when the droplet became stable during flow through the channel, whereas breakup time was measured when the droplet broke away from the dispersed phase. The capillary number is held constant along with the viscosity of fluids, contact angle and their interfacial tension.
Table 2. Variation of droplet length and droplet formation time for varying channel width at constant Capillary number
|
Continuous phase width (wc) =100µm |
Dispersed phase width (wd) =100µm |
||||
|
Dispersed Phase width (wd) [µm] |
Droplet Length [µm] |
Time taken [s] |
Continuous Phase width (wc) [µm] |
Droplet Length [µm] |
Time taken [s] |
|
50 |
113.00 |
0.6000 |
50 |
113.93 |
0.1500 |
|
60 |
120.90 |
0.4910 |
60 |
130.95 |
0.1935 |
|
70 |
129.74 |
0.4460 |
70 |
145.29 |
0.2250 |
|
80 |
136.25 |
0.4090 |
80 |
155.72 |
0.2645 |
|
90 |
143.46 |
0.3830 |
90 |
137.35 |
0.3210 |
|
100 |
147.50 |
0.3685 |
100 |
147.50 |
0.3685 |
|
120 |
155.59 |
0.3570 |
120 |
170.87 |
0.4900 |
|
140 |
177.12 |
0.3130 |
140 |
197.08 |
0.6300 |
|
160 |
195.34 |
0.3300 |
160 |
197.50 |
0.7900 |
|
180 |
219.23 |
0.3300 |
180 |
225.42 |
0.9740 |
|
200 |
240.25 |
0.3240 |
200 |
228.26 |
1.2000 |
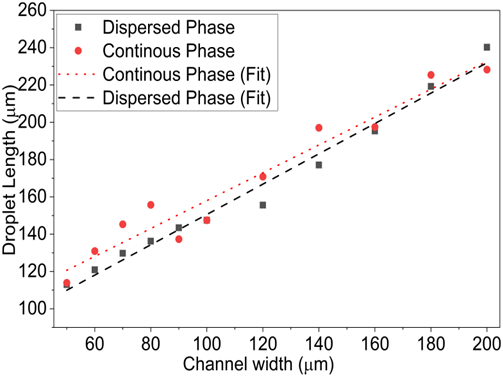
The results are plotted in Fig. 7 and Fig. 8 for better understanding. The results showed that an increase in the width of either channel resulted in an increase in droplet length. Except for a few errors, it was observed that the rate of increase in droplet length remained almost linear and was similar for both cases of channel width increase. This was verified by plotting a least-squares fitting of the graph, as shown in Fig. 7. The observation of dispersed phase width increase can be attributed to the more amount of fluid filling the channel before breakup, making the droplet size larger, which is consistent with classic studies [13].
The droplet formation time decreased with an increase in the dispersed phase channel width as a large volume of fluid entered the narrow channel, making it larger in size and breaking up soon. Interestingly, when the continuous phase channel width was increased, the droplet took more time to break away from the bulk of fluid (dispersed phase). A sharp increase in formation time was observed as the continuous channel width increased. As the continuous phase channel width increases the pressure exerted on dispersed phase also increases which will make the dispersed phase liquid take longer time to build up sufficient pressure before the breakup which will make the droplet longer. This behavior causes the droplet to take a long time to breakup making it larger in size, and this observation is consistent with the study done in the literature [27]. However, the increase in the dispersed channel width had a moderate effect on the formation time, as the time of breakup remained constant after the channel width increase went beyond 100 . This implies that droplet dynamics are more sensitive to the continuous channel width, highlighting the importance of proper control of this parameter.
 |
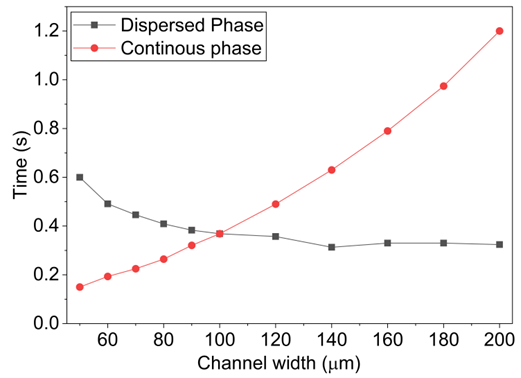 |
| Fig. 7. Variation of droplet length with channel width |
Fig. 8. Effect of channel width on droplet formation time |
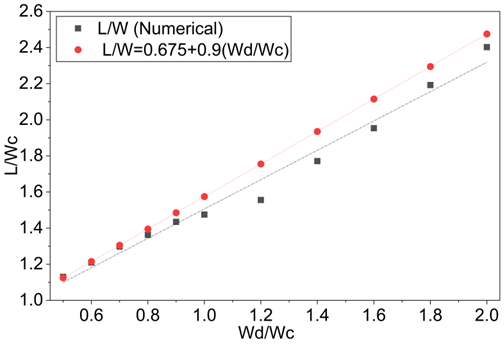
Under constant capillary number (Ca~0.02) conditions, the effect of channel geometry on droplet length was examined by independently varying the dispersed-phase and continuous-phase channel widths as given in the previous section. Although both plots are presented in terms of the channel width ratio, the two cases correspond to distinct physical variations, i.e., increasing dispersed-phase width at fixed continuous-phase width and increasing continuous-phase width at fixed dispersed-phase width. A empirical relation was derived to determine the relation between the channel width and L/w ratio and the resulted values were compared with the numerical results in the Fig. 9a and Fig. 9b.
For a fixed continuous-phase width (wc =100μm), the droplet length increased monotonically with dispersed-phase width, and the normalized droplet length followed the empirical correlation, indicating a near-linear dependence on the channel width ratio as shown in Fig. 9a.
| $\frac{L}{W} = 0.675 + 0.9 \frac{w_d}{w_c}$ | (7) |
 |
 |
| a) | b) |
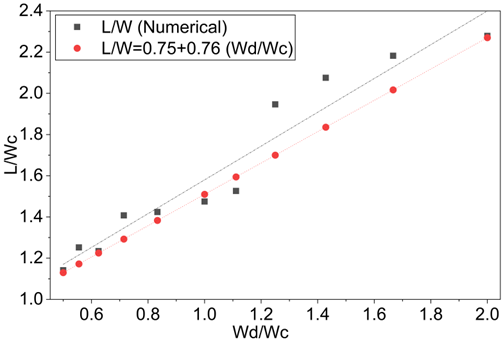
Fig. 9. Comparison between numerical results and empirical correlations for normalized droplet length as a function of channel width ratio: (a) increasing continuous-phase channel width at fixed dispersed-phase width, and (b) increasing dispersed-phase channel width at fixed continuous-phase width
Conversely, for a fixed dispersed-phase width (wd=100μm), increasing the continuous-phase channel width reduced the normalized droplet length due to weakened geometric confinement, yielding the correlation as shown in the Fig. 9b. These results demonstrate that, under fixed flow conditions, droplet elongation is primarily governed by geometric confinement, with the dispersed-phase width controlling droplet growth and the continuous-phase width regulating the effectiveness of viscous squeezing at the junction.
| $\frac{L}{W} = 0.75 + 0.76 \frac{w_d}{w_c}$ | (8) |
3.2 Effect of Phase Velocity
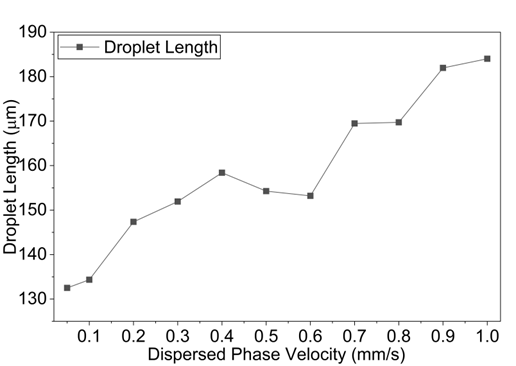
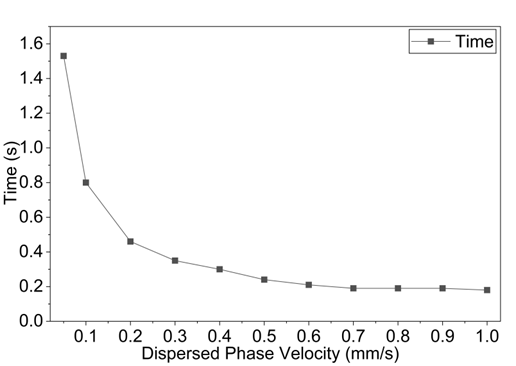
This section examines the impact of phase velocity. To concentrate on phase velocity, the geometry (100\mu m) and all the other parameters (viscosity, density, contact angle and interfacial tension) were kept constant. The simulation results examining the impact of dispersed phase velocity on droplet dynamics are shown in Table 3. The dispersed phase velocity gradually increased from 0.05 mm/s to 1mm/s, keeping the continuous phase velocity constant at 3.47mm/s. The results are also plotted in Fig. 10. These results show that when dispersed phase velocity increases droplet length also increases. A tenfold increase in dispersed phase velocity was found to result in a 37% increase in droplet length. Overall, it was discovered that the dispersed phase velocity and droplet length had a nearly linear relationship. Fig. 11 illustrates the effect of dispersed phase velocity on the time taken for droplet breakup. As evident from the graph (Fig. 10), higher dispersed phase velocities result in shorter droplet formation times. This decrease in time is initially drastic in nature, but this curve flattens as the dispersed phase velocity increases further. Beyond the velocity of 0.6mm/s, there is no significant reduction in droplet formation time is observed.
Table 3. Effect of Dispersed Phase Velocity on Droplet length and time taken for droplet formation
|
Continuous Phase velocity = 3.47mm/s |
||
|
Dispersed Phase velocity [mm/s] |
Droplet Length [µm] |
Time Taken [s] |
|
0.05 |
132.50 |
1.53 |
|
0.1 |
134.34 |
0.80 |
|
0.2 |
147.36 |
0.46 |
|
0.3 |
151.92 |
0.35 |
|
0.4 |
158.40 |
0.30 |
|
0.5 |
154.27 |
0.24 |
|
0.6 |
153.21 |
0.21 |
|
0.7 |
169.48 |
0.19 |
|
0.8 |
169.74 |
0.19 |
|
0.9 |
181.97 |
0.19 |
|
1 |
184.03 |
0.18 |
 |
 |
|
Fig. 10. Variation of droplet length with dispersed phase velocity |
Fig. 11. Dependence of droplet formation time on dispersed phase velocity |
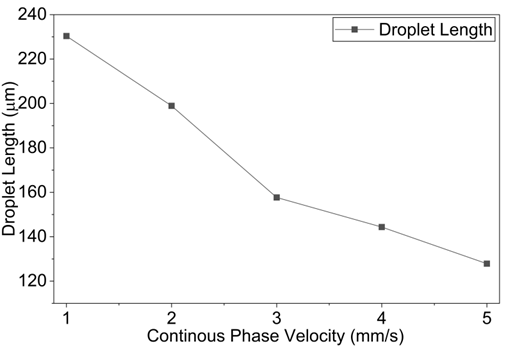
Table 4. below presents the results of the effect of continuous phase velocity on droplet dynamics. Contrary to the previous observation, an increase in continuous phase velocity resulted in a decrease in droplet length. The continuous phase velocity varied from 1 mm/s to 5 mm/s, which will lead to an increase in the Ca and a change in the formation regime. Thus, the study was limited to smaller flow velocities, while the dispersed phase velocity was kept constant. The results are also plotted in Fig. 12 and Fig. 13. The graph (Fig.12) indicates a gradual decrease in droplet length with increased continuous phase velocity. This occurs because the continuous phase liquid overcomes the interfacial tension, breaking the dispersed phase due to the higher velocity. Unlike the case of increased dispersed phase velocity, where droplet formation time decreased significantly, the reduction in droplet formation time with increased continuous phase velocity was much more gradual, as shown in Fig. 13.
Table 4. Effect of continuous Phase Velocity on Droplet length and time taken for droplet formation
|
Dispersed Phase Velocity = 0.28mm/s |
||
|
Continuous Phase velocity [mm/s] |
Droplet Length [µm] |
Time [s] |
|
1 |
230.357 |
0.66 |
|
2 |
198.925 |
0.49 |
|
3 |
157.692 |
0.40 |
|
4 |
144.348 |
0.34 |
|
5 |
127.848 |
0.28 |
 |
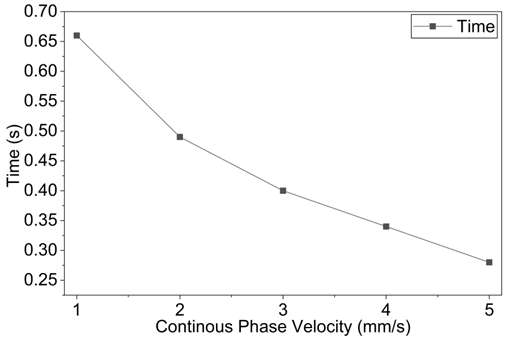 |
| Fig. 12. Variation of droplet length with continuous phase velocity | Fig. 13. Dependence of droplet formation time on continuous phase velocity |
4 Conclusions
A Computational Fluid Dynamics (CFD) simulation of two-phase flow in a T-junction microfluidic device was conducted to identify the optimal geometry and flow rate for droplet formation dynamics. The study involved setting up a computational flow domain with realistic boundary conditions. Flow and fluid properties were chosen to be as realistic as possible with minimal idealization to ensure the results closely align with real-world conditions while reducing the computational time. The results revealed a significant influence of channel dimensions and phase velocities on droplet length and formation times which are of critical importance. The study helps to identify systems suitable for specific applications such as high-throughput systems, where faster droplet formation is essential (e.g., diagnostics or emulsification), a dispersed or a continuous phase width of 50–80 µm and dispersed phase velocity of 0.05–2 mm/s or a continuous phase velocity of 3–5 mm/s are recommended, producing droplets with lengths between approximately 110–160 µm and formation times of 0.2–0.6 s. For applications requiring larger droplets, such as encapsulation or slow-release systems, a dispersed or continuous phase width of 160–200 µm, lower continuous phase velocities (1–2 mm/s) or higher dispersed phase velocities (0.7–1 mm/s) are ideal, yielding droplets of 198–230 µm with slightly longer formation times (0.5–1 s). These approximate findings emphasize the importance of balancing droplet size, formation time, channel width and flow velocities to meet the specific demands of applications in pharmaceuticals, food processing, and material synthesis. In summary, this study advances existing T-junction microfluidic analyses by providing a validated numerical framework that simultaneously captures droplet length and breakup time under realistic fluid properties and by proposing simple predictive correlations that enhance the design-level applicability of the results.
Acknowledgements
The authors would like to thank the Manipal Institute of Technology, Manipal Academy of Higher Education, for the procurement of COMSOL Multiphysics software for the present work.
References
- T. Dong, J. X. Wang, Y. Wang, G. H. Tang, Y. Cheng, and W. C. Yan, “Development of machine learning based droplet diameter prediction model for electrohydrodynamic atomization systems,” Chem. Eng. Sci., vol. 268, Mar. 2023, doi: 10.1016/j.ces.2022.118398.
- G. F. Christopher and S. L. Anna, “Microfluidic methods for generating continuous droplet streams,” Oct. 07, 2007. doi: 10.1088/0022-3727/40/19/R01.
- C. Lu and I. Willner, “Stimuliresponsive DNA‐funktionalisierte Nano‐ und Mikrocontainer zur schaltbaren und kontrollierten Freisetzung,” Angew. Chemie, vol. 127, no. 42, pp. 12380–12405, Oct. 2015, doi: 10.1002/ange.201503054.
- Q. Wang, Q. Liu, L. L. Fan, and L. Zhao, “The formation of droplet encapsulating particles in a Y-typed microchannel,” Meas. Sensors, vol. 14, Apr. 2021, doi: 10.1016/j.measen.2021.100039.
- M. Tembely, D. C. Vadillo, A. Dolatabadi, and A. Soucemarianadin, “A Machine Learning Approach for Predicting the Maximum Spreading Factor of Droplets upon Impact on Surfaces with Various Wettabilities,” Processes, vol. 10, no. 6, Jun. 2022, doi: 10.3390/pr10061141.
- A. Venkateshwarlu and R. P. Bharti, “Hydrodynamics of Two-Phase Immiscible Flow in T-Junction Microchannel,” in Lecture Notes in Mechanical Engineering, Springer Science and Business Media Deutschland GmbH, 2024, pp. 267–275. doi: 10.1007/978-981-99-6074-3_25.
- N. Convery and N. Gadegaard, “30 years of microfluidics,” Mar. 01, 2019, Elsevier B.V. doi: 10.1016/j.mne.2019.01.003.
- A. Sattari, P. Hanafizadeh, and M. Hoorfar, “Multiphase flow in microfluidics: From droplets and bubbles to the encapsulated structures,” Aug. 01, 2020, Elsevier B.V. doi: 10.1016/j.cis.2020.102208.
- D. J. Beebe, G. A. Mensing, and G. M. Walker, “Physics and applications of microfluidics in biology,” 2002. doi: 10.1146/annurev.bioeng.4.112601.125916.
- S. Hettiarachchi et al., “Design and development of a microfluidic droplet generator with vision sensing for lab-on-a-chip devices,” Sensors Actuators A Phys., vol. 332, Dec. 2021, doi: 10.1016/j.sna.2021.113047.
- K. Fallah and E. Fattahi, “Splitting of droplet with different sizes inside a symmetric T-junction microchannel using an electric field,” Sci. Rep., vol. 12, no. 1, Dec. 2022, doi: 10.1038/s41598-022-07130-6.
- E. Roumpea, N. M. Kovalchuk, M. Chinaud, E. Nowak, M. J. H. Simmons, and P. Angeli, “Experimental studies on droplet formation in a flow-focusing microchannel in the presence of surfactants,” Chem. Eng. Sci., vol. 195, pp. 507–518, Feb. 2019, doi: 10.1016/j.ces.2018.09.049.
- P. Garstecki, M. J. Fuerstman, H. A. Stone, and G. M. Whitesides, “Formation of droplets and bubbles in a microfluidic T-junction - Scaling and mechanism of break-up,” Lab Chip, vol. 6, no. 3, pp. 437–446, 2006, doi: 10.1039/b510841a.
- W. Lan, S. Li, Y. Wang, and G. Luo, “CFD simulation of droplet formation in microchannels by a modified level set method,” Ind. Eng. Chem. Res., vol. 53, no. 12, pp. 4913–4921, Mar. 2014, doi: 10.1021/ie403060w.
- S. G. Sontti and A. Atta, “CFD analysis of microfluidic droplet formation in non–Newtonian liquid,” Chem. Eng. J., vol. 330, pp. 245–261, 2017, doi: 10.1016/j.cej.2017.07.097.
- C. Dianita, R. Piemjaiswang, and B. Chalermsinsuwan, “CFD simulation and statistical experimental design analysis of core annular flow in T-junction and Y-junction for oil-water system,” Chem. Eng. Res. Des., vol. 176, pp. 279–295, Dec. 2021, doi: 10.1016/j.cherd.2021.10.011.
- A. Venkateshwarlu and R. P. Bharti, “Effects of capillary number and flow rates on the hydrodynamics of droplet generation in two-phase cross-flow microfluidic systems: Hydrodynamics of droplet generation in two-phase cross-flow microfluidic systems,” J. Taiwan Inst. Chem. Eng., vol. 129, pp. 64–79, Dec. 2021, doi: 10.1016/j.jtice.2021.07.045.
- M. Bourega, I. Kromba, K. F. Arbi, and S. Soulimane, “Effect of Velocity Ratio, Viscosity Ratio, Contact Angle, and Channel Size Ratio on Droplet Formation,” Fluid Dyn. Mater. Process., vol. 19, no. 10, pp. 2471–2480, 2023, doi: 10.32604/fdmp.2023.028661.
- J. D. Wehking, M. Gabany, L. Chew, and R. Kumar, “Effects of viscosity, interfacial tension, and flow geometry on droplet formation in a microfluidic T-junction,” Microfluid. Nanofluidics, vol. 16, no. 3, pp. 441–453, 2014, doi: 10.1007/s10404-013-1239-0.
- M. A. W. Adhicahya, R. Irwansyah, A. Ooi, and Harinaldi, “Numerical analysis of droplet formation in T-junction microchannel at low Weber and Capillary numbers,” Int. J. Thermofluids, vol. 30, Nov. 2025, doi: 10.1016/j.ijft.2025.101435.
- A. Ahmadpour, M. Shojaeian, and S. Tasoglu, “Deep learning-augmented T-junction droplet generation,” iScience, vol. 27, no. 4, Apr. 2024, doi: 10.1016/j.isci.2024.109326.
- H. Zhao et al., “On-demand droplet formation at a T-junction: modelling and validation,” Microsystems Nanoeng., vol. 11, no. 1, Dec. 2025, doi: 10.1038/s41378-025-00950-2.
- T. T. Nguyen and T. Van Hoang, “Effect of geometry ratios on droplet breakup in a T-junction microchannel: A theoretical predictive model,” Chinese J. Chem. Eng., Dec. 2025, doi: 10.1016/j.cjche.2025.07.005.
- R. Raj, N. Mathur, and V. V. Buwa, “Numerical simulations of liquid-liquid flows in microchannels,” in Industrial and Engineering Chemistry Research, Nov. 2010, pp. 10606–10614. doi: 10.1021/ie100626a.
- X. Bin Li, F. C. Li, J. C. Yang, H. Kinoshita, M. Oishi, and M. Oshima, “Study on the mechanism of droplet formation in T-junction microchannel,” Chem. Eng. Sci., vol. 69, no. 1, pp. 340–351, Feb. 2012, doi: 10.1016/j.ces.2011.10.048.
- S. Bashir, J. M. Rees, and W. B. Zimmerman, “Simulations of microfluidic droplet formation using the two-phase level set method,” Chem. Eng. Sci., vol. 66, no. 20, pp. 4733–4741, Oct. 2011, doi: 10.1016/j.ces.2011.06.034.
- S. K. Jena, T. Srivastava, S. S. Bahga, and S. Kondaraju, “Effect of channel width on droplet generation inside T-junction microchannel,” Phys. Fluids, vol. 35, no. 2, Feb. 2023, doi: 10.1063/5.0134087.
Conflict of Interest Statement
There are no conflicts of interest in the current study.
Author Contributions
Data Availability Statement
The data will be available on request.
Supplementary Materials
No additional supplementary materials to add.