Volume 23 article 1304 pages: 688-705
Received: May 21, 2025 Accepted: Oct 20, 2025 Available Online: Nov 18, 2025 Published: Dec 15, 2025
DOI: 10.5937/jaes0-59005
PERFORMANCE AND TECHNICAL FEASIBILITY STUDY OF WIND TURBINE FOR ACHIEVING ENERGY INDEPENDENCE: A CASE STUDY IN BANGOWAN TOURIST VILLAGE, INDONESIA
Abstract
This study evaluates the feasibility of wind energy for energy independence in Bangowan Tourist Village, Central Java, Indonesia, using real-time monitoring via the ThingSpeak Internet of Things (IoT) platform. The novelty of this work lies in combining IoT-based real-time monitoring with Archimedes turbines to assess renewable energy feasibility in a rural tourist village context. The average wind speed was 6.04 m.s-1. A single Archimedes turbine produced 5,284 Wh/day, while two turbines generated 10,568 Wh/day, equal to 32.95% of the 32,075 Wh daily demand. Regression analysis showed a modest but significant correlation between wind speed and power (p = 0.043; R² = 0.049), while Tip Speed Ratio–Coefficient of Performance (TSR–Cp) analysis revealed a strong relationship (R² = 0.867). The most effective configuration combined two turbines, 2 kWp photovoltaic (PV), and a 5 kVA generator set (genset) operating 4 h/day, achieving 108.81% adequacy at ~56 million Indonesian Rupiah (IDR). Results confirm that small-scale wind is feasible if integrated into modular hybrid systems with IoT monitoring for reliable, cost-effective rural electrification.
Highlights
- Real-time IoT (ThingSpeak) monitoring used to assess wind energy feasibility in a rural tourist village.
- Archimedes turbines produced up to 10,568 Wh/day, covering 32.95% of village electricity demand.
- Strong TSR–Cp correlation (R² = 0.867) reveals high aerodynamic efficiency at low wind speeds.
- Hybrid system (wind + 2 kWp PV + genset) achieved 108.81% energy adequacy at low investment cost.
Keywords
Content
1 Introduction
1.1 Rural Tourist
Tourism in rural areas is critical in achieving progress in the economic, social, and cultural sectors [1]. Tourist Villages are essential to sustainable tourist development in Indonesia, with 6,108 tourist villages. The existence of tourist villages not only provides a unique experience for tourists but also creates opportunities to improve the economy of rural communities through small businesses, culture-based lodging, traditional cuisine, and handicrafts. The goal of sustainable tourist development leads to job creation, improvement of local infrastructure, and business opportunities for the community [2]. Various technologies and innovations have been developed in strategically planning sustainable tourist destinations, including the Data-Driven Sustainable Smart City Framework (DDSSCF) Platform [3]. One of the conditions that must be met in a tourist village is the guarantee of the availability of electrical energy in the area. Reliable electricity in tourist village areas can support the growth of tourist businesses to improve the community's economy [4].
This research explores the prospect of applying wind as a clean energy source to power generation in tourist village areas. Although many studies on renewable energy apply wind power to the tourist sector, research on the potential of data-based wind energy in tourist villages is still minimal. Copping et al. [5] explore applying ecological risk-based approaches in managing wind energy development within wind farm settings. This contrasts with the context of tourist villages discussed in this study. In addition to discussing ecological aspects, the research also discusses environmental and social factors, and there is no discussion based on real-time data on wind turbines. The study of Sedai et al. [6] is a large-scale study (estimated at US$7-9 million) addressing the electrification of remote areas using a combination of solar and wind with a feasibility study-based approach. In contrast, this study evaluates the performance of wind turbines in real-time based on ThingSpeak, specifically for small tourist villages that are far from the reach of electricity.
This research is essential because it is directly related to the potential of wind energy, which is the main factor in managing renewable energy in tourist villages. Please note that wind energy is intermittent [7] (not always available at all times), so if the tourist village only relies on energy from this renewable energy without paying attention to its potential availability, it may be at risk. As a result, it can experience power outages when tourists visit in large numbers [8]. This will undoubtedly affect the quality of tourist attractions and the village's attractiveness as a commercial destination. By analyzing the feasibility and potential of wind energy, tourist villages can carry out planning and management to ensure that electricity remains available even when demand is high [9].
The lack of research examining the pattern of renewable energy availability based on real-time data in tourist villages can hinder stakeholders in making decisions regarding renewable energy management goals. Chiwaridzo [10] emphasizes the importance of renewable technologies for energy independence in Zimbabwe’s tourism industry, while Li et al. [11] highlight how the transition to renewable energy plays a crucial role in minimizing the environmental impacts of international tourism. These insights confirm that accurate, real-time data are essential for supporting carbon reduction and promoting environmentally friendly tourism. Osorio-Molina et al. [12] further provide a systematic review on tourism, energy, and sustainability, showing that the absence of real-time information often leads to suboptimal investment and infrastructure decisions. Similarly, Jahangiri et al. [4] stress that relying on outdated data reduces the accuracy of feasibility assessments and increases the risk of poor energy planning. Therefore, a responsive, real-time data-driven monitoring system is urgently needed to overcome these challenges and enhance decision-making accuracy.
The Internet of Things (IoT) enables the connection of physical objects to internet-based systems for automatic data exchange. For example, Tehrani and Atarodi [13] designed a high-precision energy monitoring system for smart energy applications. Krishna Rao et al. [14] applied IoT for intelligent energy management with forecasting and optimization capabilities. More recently, Mallala et al. [15] demonstrated IoT-based systems for power quality analysis and real-time alerts. These examples highlight the suitability of IoT for renewable energy monitoring, particularly in rural tourist villages where real-time data is crucial for ensuring a reliable energy supply. For instance, Mallala et al. [15] demonstrated IoT-based systems capable of monitoring power quality with real-time alerts, while Verma et al. [16] reviewed environmental parameter monitoring systems to estimate renewable energy generation. Beyond parameter tracking, Vairavasundaram et al. [17] developed an IoT-based monitoring system for Doubly Fed Induction Generators (DFIGs) wind turbines under voltage dips. Similarly, Bekirsky et al. [18] provided a systematic review of actor involvement in multi-renewable complementarity, emphasizing the role of real-time data for system coordination. Boričić et al. [19] further reviewed short-term voltage stability evaluation methods, confirming that continuous monitoring enhances grid reliability and supports data-driven decision-making. Almihat and Kahn [20] further demonstrated how centralized control systems for islanded microgrids depend on real-time monitoring to balance distributed renewable generation.
This research offers a new approach to mapping the availability of data-based renewable energy in tourist villages, emphasizing real-time monitoring using the ThingSpeak platform. This contrasts with previous studies focusing on historical data [21] and/or simulation [21]. The study by Singh et al. [22] shows how real-time data may serve to evaluate wind turbine performance under simulated conditions. A similar approach was used in this study, which focused more on directly monitoring the wind turbines' performance of the installed setup through the ThingSpeak IoT platform. In addition, recent research in Indonesia shows that wind energy potential varies between regions. For example, a study by Wijanarko et al. [23] assessed the wind potential in West Java, Papua, and East Kalimantan, with the result that Papua has the highest potential, reaching 36.23 W/m². This emphasizes the need for a specific location-based study, such as in the Bangowan Tourism Village. In terms of turbine design, Wijayanto et al. [24] proved that the combination of fiberglass-made Savonius–Darrieus turbines can improve aerodynamic performance in urban areas, providing a relevant comparison with the Archimedes turbines selected in this study. Technology trends also point to the use of five-bladed 3D printing-based micro turbines, which have proven to be more efficient in wind tunnel tests [25], thus opening up innovation opportunities for small-scale applications in tourism villages.
To assessing energy potential, the operational aspects of wind turbines are also an important concern. For instance, Shalby et al. [25] investigated the use of 3D-printed micro wind turbines and highlighted efficiency challenges in small-scale applications. In a related study, Shalby et al. [26] analyzed dust accumulation in Ma’an wind farms, showing how it reduces energy production by up to 6.4 million kWh per year. More recently, Shalby et al. [27] examined how clogged filters in the nacelle can increase operating temperatures by more than 15°C, underscoring the importance of effective maintenance strategies.
Recent reviews further highlight the importance of robust modelling frameworks for renewable energy planning. In the 2024, Samarasinghe [28] analyzed thirty energy modelling tools, highlighting their applicability for achieving net-zero emission targets. In the same year, Mundu et al. [29] provided a critical review of simulation-based methodologies, stressing the need for more robust approaches to capture system dynamics. Likewise, Thirunavukkarasu [30] in 2023 presented a comprehensive review on hybrid renewable energy system optimization, while Giedraityte et al. [31] in 2025 extended the discussion by integrating technical, economic, and environmental criteria into hybrid system evaluations. These most recent contributions indicate that energy system studies are shifting toward holistic, multi-dimensional approaches, underscoring the necessity of combining technical feasibility with real-time monitoring to ensure practical relevance.
So, the novelty of this research lies in using data observed in real-time with IoT ThingSpeak to map the availability of renewable energy sources from wind turbines in tourist villages. Through this approach, the purpose of the research can be detailed, namely, identifying potential renewable energy sources in tourist villages based on local environmental conditions, such as wind speed.
The next goal is to measure and map the availability of wind energy using real-time monitoring on the ThingSpeak IoT platform. Once the potential renewable energy sources of tourist villages and their availability are known, we will be able to analyze the fluctuations in power and energy produced and evaluate what factors affect the stability of their production. Finally, we will have IoT-based renewable energy mapping model data that can be applied in tourist villages as a reference for stakeholders in renewable energy management.
1.1 Location and Characteristics of Tourist Villages
This research was conducted in Bangowan Tourism Village, Blora, Central Java (6°56'50.6"S 111°31'24.4"E), which won second place nationally in the Pioneer Tourism Village category in the Indonesian Tourism Village Award (ADWI) 2024 [32]. According to Communication and Information Office (Dinkominfo) [33], this region has a varied topography (lowlands to mountains) and a two-season tropical climate. The rainy season lasts from November to April, with high rainfall accompanied by strong winds and lightning, while the dry season of May to October tends to be dry with temperatures of 22–33°C. The geographical location of Bangowan Village and its surrounding characteristics are are depicted in Fig. 1.
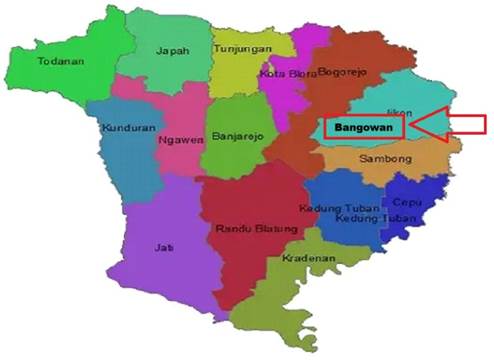
Fig. 1. Map of Bangowan Village, Indonesia
The area of Bangowan Village is 600.9 Ha [34]. It is located at an altitude of 126 meters above sea level, with a wind speed of 6 m.s-1 [35]. Based on research by Dorzhiev and Rosenblum [36], about 10% of studies noted that at low wind speeds, an average of 4-6 m.s-1 wind turbines can operate, although it is recommended that a minimum wind speed of 7 m.s-1 is maintained. Bangowan Village has a tourist destination called "Bukit Kunci", with an average number of 600 daily tourists [34]. Community activities and the number of tourists visiting them will automatically affect energy consumption patterns in the village. The energy available in the Bangowan tourist village is electricity from State Electricity Company (PLN), Indonesia’s state-owned electricity company. Electricity consumption in the village fluctuates, not always steadily, throughout the year. On weekdays, electricity consumption tends to be expected, with energy needs coming from households, public facilities, and small businesses such as stalls and lodgings. But when entering school holidays and long holidays, energy consumption increases drastically along with the increase in the number of tourists, especially in homestays, stalls, and tourist attractions that extend their operations compared to normal days. In Bangowan Village, two units of wind power plants from the Archimedes turbine have been installed, as seen in Fig. 2.
The Archimedes Wind Turbine was chosen because it proved efficient at low wind speeds based on simulations and experimental tests [29]. The turbines in the tourist village have a diameter of 1.5 m, a length of 1.2 m, and a sweeping area of 1.77 m², with a generator of 500 W (12 V direct current (DC)) and a maximum output power of 200 W (220 V alternating current (AC)). The cut-in speed is 1.1 m.s-1, and the rated speed is 5.2 m.s-1, while the cut-out is considered zero because it remains operational in strong winds. The circular three-blade design supports efficiency in low-wind areas, as well as being environmentally friendly and attracting tourists.
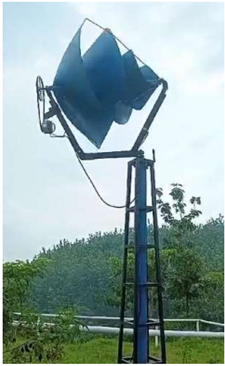
Fig. 2. Wind energy installed in the tourist village
2 Materials and methods
The pre-processing stage includes the identification of the tourist village's electricity needs, sensor installation and validation, and data collection. The survey was conducted on 86 heads of families out of 589 total, based on the Slovin formula [37], to determine the use of electrical equipment and the duration of its use. Public facilities also collect data to obtain a comprehensive picture of energy needs. The sensor is installed and validated by comparing the results against standard measuring instruments (multimeter, tachometer, and anemometer), and the error rate is calculated as a percentage of the total readings. The sensor is installed and validated by comparing the results against standard measuring instruments (multimeter, tachometer and anemometer), and the error rate is calculated as a percentage of the total readings. Table 1 summarizes the specifications and accuracy of the instruments used in this study.
Table 1. Measurement instruments and specifications
|
Instrument |
Model |
Measurement Range |
Accuracy |
Use |
Reference |
|
Anemometer |
RS-FSJT (ZTS-3000 series) |
0.5 – 50 m.s-1 (wind speed) |
±3% FS |
Monitoring wind speed |
RS-FSJT Datasheet [38] |
|
Digital Multimeter |
Kyoritsu (KEW 1009 series) |
V: 0–600 V AC/DC, I: up to 10 A, R: up to 40 MΩ |
±0.5% (DC V), ±1.0% (AC V), ±1.5% (Current) |
Voltage, current, resistance validation |
Kyoritsu Manual [39] |
|
Tachometer |
CT6235B |
0 – 20,000 rpm (rotation), 5 cm/min – 2 km/min (linear) |
±0.05% reading + 1 digit |
Rotor speed (RPM) and torque calculations |
CT6235B Manual [40] |
The specifications and accuracy of the measurement instruments used in this study are summarized in Table 1. These instruments were employed to validate the installed sensors and ensure reliable data acquisition. After validation, the integration of the sensors into the wind turbine system was carried out, as illustrated in Fig. 3.
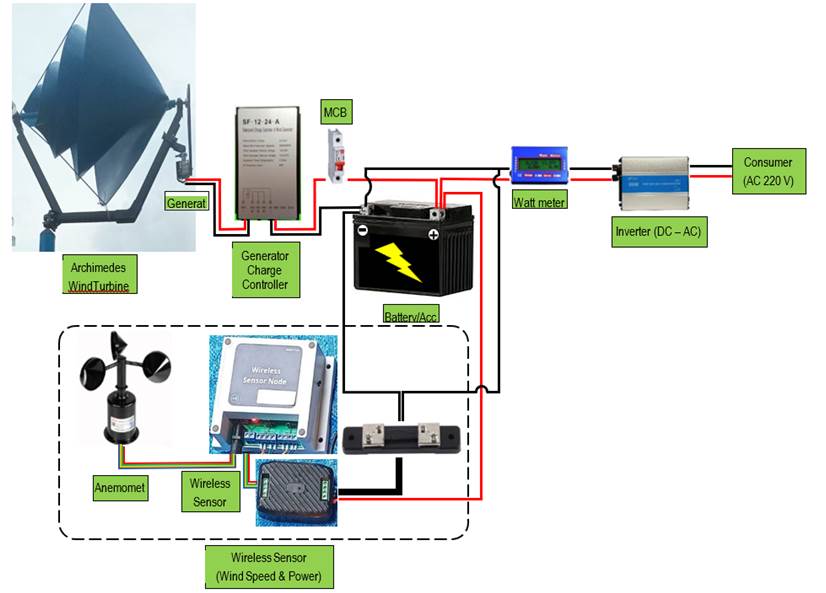
Fig. 3. Wind turbine scheme with sensors
After the sensor is declared valid, data monitoring is carried out in real-time if the accuracy is more than 90% and with a minimal variance [41]. Key data was obtained from wind energy monitoring using the ThingSpeak platform, which records the performance of wind turbines in real time, following the steps shown in Fig. 4.
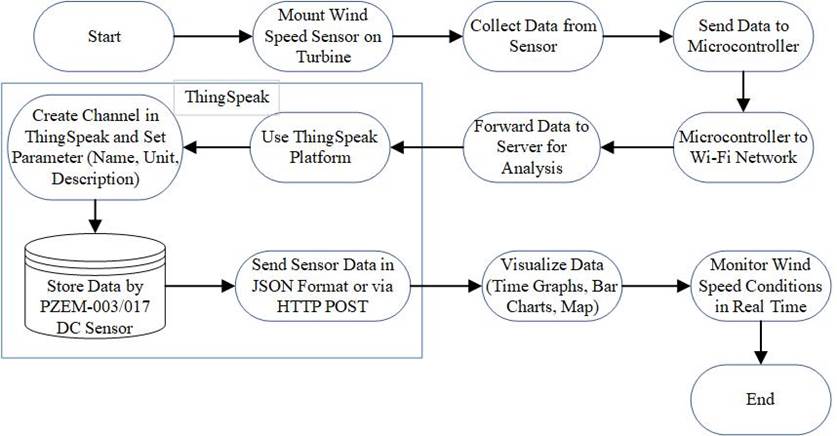
Fig. 4. ThingSpeak IoT sensor data flow and monitoring diagram [42]
Sensor data monitoring begins with the installation of wind speed sensors. The data obtained is sent to a microcontroller connected to the Wi-Fi network and forwarded to the server for analysis. On the ThingSpeak platform, users can send sensor data in JavaScript Object Notation (JSON) format or via Hypertext Transfer Protocol (HTTP) POST method [42]. Each user creates a channel in ThingSpeak that stores the data collected by the PZEM-003/017 DC sensor. In addition, users can set parameters such as name, unit, and description. ThingSpeak also provides tools to visualize data through time graphs, bar charts, and maps, allowing users to monitor conditions and obtain real-time data on wind speed, voltage, current, power, and energy.
The feasibility of wind turbines is analyzed through two stages. First, energy potential estimation is carried out by associating wind speed data and turbine power curves, then comparing it with the electricity needs of tourist villages [43]. Second, turbine performance was evaluated using wind speed, revolutions per minute (RPM), Tip Speed Ratio (TSR), and power coefficient (Cp) data from February to April 2025.
The TSR and (Cp) are widely used indicators of energy conversion efficiency in wind turbines. As explained by Jha [44], the theoretical maximum value of Cp is 0.593, a limit established by Betz’s law. However, Khan [45] critically examined this concept and proposed alternative approaches for evaluating wind turbine performance beyond the traditional Betz limit. Cp is calculated using Eq. (2).
|
|
(1) |
Where Cp is the power coefficient (dimensionless), Pmechanics is the mechanical power generated by the turbine (W), and Paerodynamic is the aerodynamic power available in the wind before interacting with the turbine (W). Paerodynamic calculated using Eq. (3).
|
|
(2) |
Where Paerodynamic is the aerodynamic wind power (W), ρ is the air density (1,225 kg/m³), A is the rotor swept area (m2), and V is the wind speed (m.s-1)
The values of turbine power (P) and wind speed (V) were obtained from IoT-based ThingSpeak's monitoring system, while the swept area (A) was calculated using πr2 based on the turbine radius. The mechanical power was then calculated using Eq. (4).
|
|
(3) |
Where Pmechanics is the mechanical power output of the turbine (W), T is the torque acting on the turbine shaft (Nm), and ω is the angular velocity of the turbine (rad.s-1), which is calculated from measured RPM values.
The post-processing stage consists of two analyses. First, the energy adequacy of the wind turbine is evaluated based on the average wind speed and compared with the electricity needs of the tourist village. If that is not enough, scenario analysis is carried out, such as installing solar panels, batteries, or limited connections to the power grid. The next stage concludes the practical implications for energy independence and the effectiveness of the monitoring system for developing sustainable energy systems in tourism villages.
3 Results and discussion
3.1 Data acquisition and sensor validation
Bangowan Tourism Village needs electricity of 32,075 Wh daily to run various facilities. The sectors with the highest consumption are government, industry, and households, as seen in Fig. 5. This information is the basis for planning a renewable energy system in the tourist village.
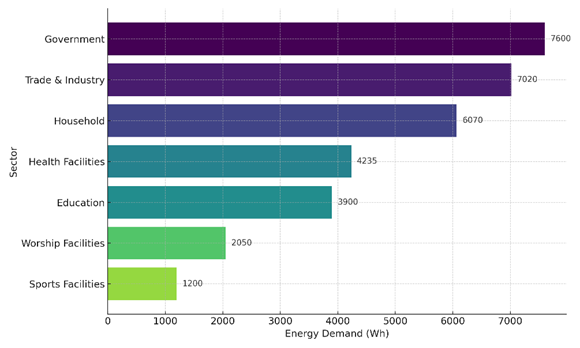
Fig. 5. Energy needs of tourist villages by sector
Wind speed data is monitored using the ThingSpeak platform, after sensor validation is carried out by comparing it with standard measuring instruments. All sensors exhibit a high level of accuracy, which is 96.59% for wind speed, 97.5% for voltage, 96.8% for current, and 96.48% for RPM. These results show that the average error is minimal and that the sensor is accurate and reliable for measurements [46]. After sensor validation is done with more than 95% accuracy, the next step is to record the data through ThingSpeak, as shown in Table 2.
Table 2. Summary of Data Recording from the ThingSpeak Platform
|
No |
Description |
ThingSpeak Recording |
|||
|
February |
March |
April |
|||
|
1 |
N Data Valid |
102,772 |
102,772 |
102,772 |
|
|
Missing |
0 |
0 |
0 |
||
|
2 |
Min |
Wind Speed (m.s-1) |
2.40 |
2.91 |
2.89 |
|
Max |
9.80 |
9.70 |
8.70 |
||
|
Average |
6.10 |
6.31 |
5.80 |
||
|
3 |
Min |
Voltage (V) |
12.18 |
12.21 |
7.66 |
|
Max |
14.36 |
14.63 |
14.35 |
||
|
Average |
12.82 |
12.9 |
11.87 |
||
|
4 |
Min |
Current (A) |
0.64 |
0.62 |
0.02 |
|
Max |
0.99 |
1 |
0.94 |
||
|
Average |
0.75 |
0.73 |
0.57 |
||
|
5 |
Min |
Power |
7.8 |
7.5 |
0.1 |
|
Max |
14.2 |
14.6 |
13.4 |
||
|
Average |
9.6 |
9.37 |
7.09 |
||
|
6 |
Min |
Energy (Wh) |
1 |
1,661 |
8,432 |
|
Max |
1,695 |
8,425 |
10,764 |
||
|
Average |
875.47 |
5,163 |
9,850 |
||
Table 2 shows that over the three months of observation, the average wind speed ranged from 5.80 to 6.31 m.s-1, enough to operate the turbine above the cut-in speed. Voltage and current show stability, with an average voltage of about 12 V and a current of 0.57–0.75 A. The highest average power was recorded in February (9.6 W), while energy production increased significantly from 875.47 Wh (February) to 9,850 Wh (April). No data is lost, indicating that data acquisition runs consistently and reliably. The raw data from the ThingSpeak recordings is available in comma-separated values (CSV) format and can be downloaded for further analysis. The effect of the wind velocity on the power output of the turbine is presented in Fig. 6.
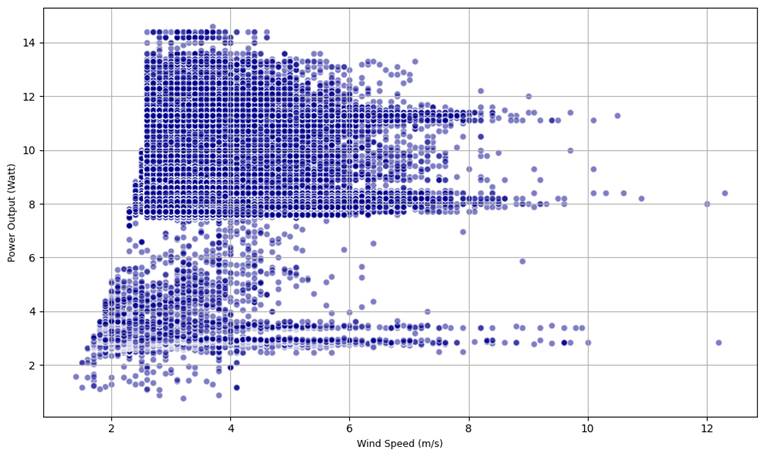
Fig. 6. Influence of wind velocity on turbine power generation
As shown in Fig. 6, the increase in wind speed is directly proportional to the increase in turbine output power, according to the wind energy productivity theory [36]. To support these findings, Fig. 7 presents the daily wind speed fluctuations at the study site from February 5 to April 5, 2025. The data showed an average wind speed of 6.04 m.s-1, with a maximum of 12.20 m.s-1. The average has exceeded the cut-in speed of 1.1 m.s-1, indicating that the turbine is viable for operation and generating power. This is in line with [46], which states that the turbine can still operate at low speeds (<2.0 m.s-1) through improvements in rotor and generator design.
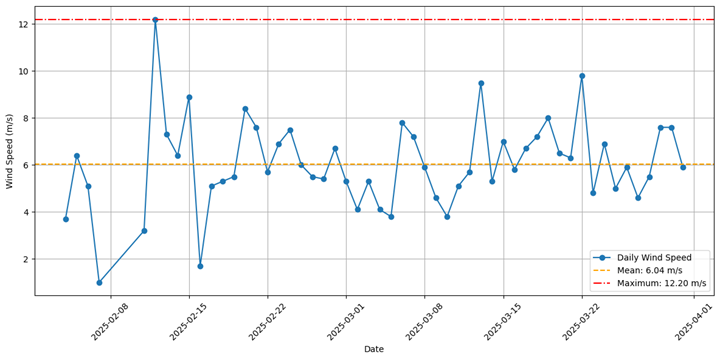
Fig. 7. Daily wind speed trend graph
A linear regression analysis between wind speed and power generated is performed to measure how wind speed affects power output, as shown in Table 3.
Table 3. Simple Linear Regression Relating Wind Velocity and Generated Power
|
Regression Coefficient |
B |
Std. Error |
t |
Sig |
R |
R2 |
F |
|
(Constant) |
-4.228 |
13.948 |
-0.303 |
0.763 |
|
|
|
|
Wind Speed |
4.660 |
2.264 |
2.059 |
0.043 |
0.222 |
0.049 |
4.238 |
The regression results (Table 3) showed that wind speed had a significant effect on electrical power (p = 0.043; F = 4.238), although the contribution was relatively small (R² = 0.049). The regression equation is:
|
Power = −4.228 + 4.660 × WindSpeed |
(4) |
Equation (4) shows that every 1 m·s-1 increase in wind speed is estimated to increase power by 4.66 W. The intercept value −4.228 is not physically significant, but is required as a component of the model. These findings are in line with [47], that is, at low wind speeds, the influence of the casing design on turbine performance is relatively small. However, as wind speeds increase, the role of the casing design becomes increasingly significant because it is able to direct airflow more efficiently to the turbine blades, thus increasing or decreasing the overall efficiency of the system.
3.2 Technical Feasibility Analysis of Wind Turbine
To test the technical feasibility of the Archimedes wind turbine in this study, an estimate of wind power potential was carried out based on Thingspeak data compared to the turbine power in theory presented in Fig. 8.
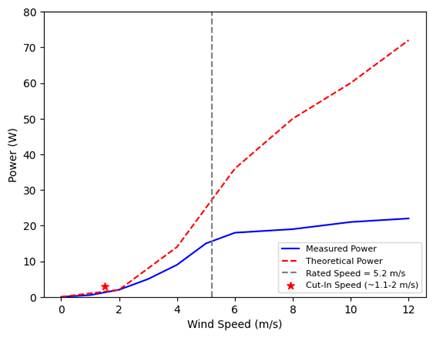
Fig. 8. Wind turbine power curve vs. measured data
Fig. 8 shows the theoretical wind turbine power curve compared to the power data measured at the tourist village location. The theoretical power increases sharply as the wind velocity rises, whereas the measured power shows a tendency to level off after a speed of about 6 m.s-1 and tends to stagnate below 25 W. At a mean wind velocity recorded of 6.04 m.s-1, which is higher than the cut-in speed (1.1 – 2 m.s-1), it can be said that the turbine is feasible to operate and generate power. However, this feasibility is not optimal because the power produced is much lower than the theoretical power produced at higher wind speeds. This is related to opinions Sedaghat, et al [48] and Emeksiz [49], which state that to ensure that the turbine operates optimally, the wind speed must often reach the Rated Speed or higher, so that the power produced is maximized by the theoretical power.
Furthermore, the potential wind energy that the turbine can generate during the observation period can be observed in Fig. 9.
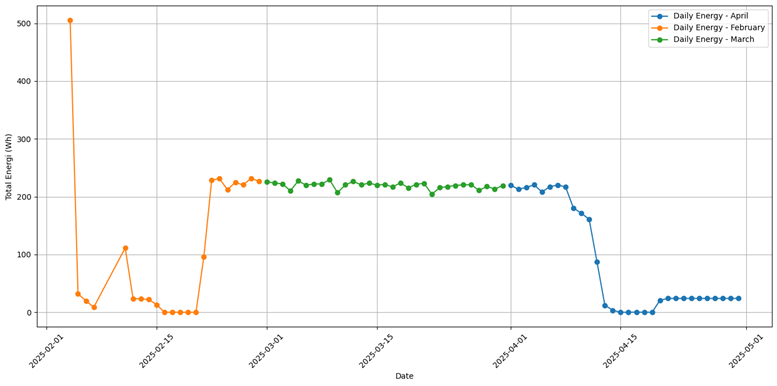
Fig. 9. Daily average energy
Fig. 9 shows the daily energy production trend from February to April 2025, which reflects the turbine’s power generation performance. Stable production in March indicates that the system is performing well in favorable wind conditions, while large fluctuations in February and sharp declines in April indicate variability in wind speed. Despite the weak stability of the energy generated due to wind variability, this small-scale wind turbine system is still technically feasible if supported by wind condition monitoring and periodic maintenance to keep its performance optimal. These results align with findings from [50], which emphasize that remote monitoring via wireless systems can improve turbine operability by reducing the frequency of direct inspections and allowing for rapid response when needed [26].
3.3 Wind Characteristics at Bangowan
Analysis of wind direction and speed at the Bangowan Village location during the January–July 2025 period is shown in Fig. 10. The distribution of wind direction based on NASA POWER data ((Wind Direction at 10 m, WD10M; Wind Speed at 10 m, WS10M)) shows that the dominant wind gusts originate from the east (E) to East-Southeast (ESE) sectors, with an incidence frequency of more than 14% of the total daily data. In addition, significant contributions were also identified from the West–Northwest (WNW) to northwest (NW) direction, albeit with lower intensity.
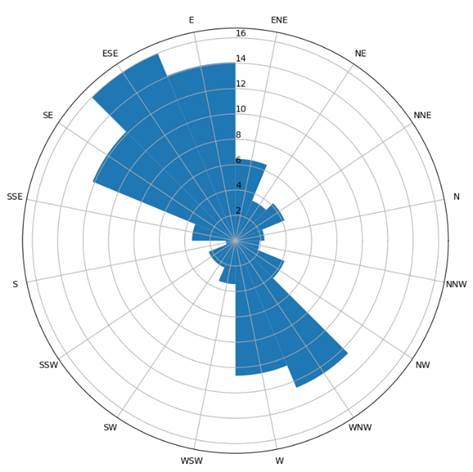
Fig. 10. Distribution of wind direction at 10 m height (January–July 2025); Source: NASA POWER data [51]
Wind rose based on wind speed class (Fig. 11) shows that most wind speeds are in the range of 2–4 m.s-1, mainly from the east–southeast sector. Meanwhile, speeds above 4 m.s-1 are relatively rare, with the main contribution coming from the northwest and east. This condition confirms that the research location is included in the category of areas with low to medium wind potential, so that the selection of low-wind speed turbines (e.g., Archimedes or Savonius-Darrieus hybrid turbines) is more appropriate than conventional turbines that require higher wind speeds.
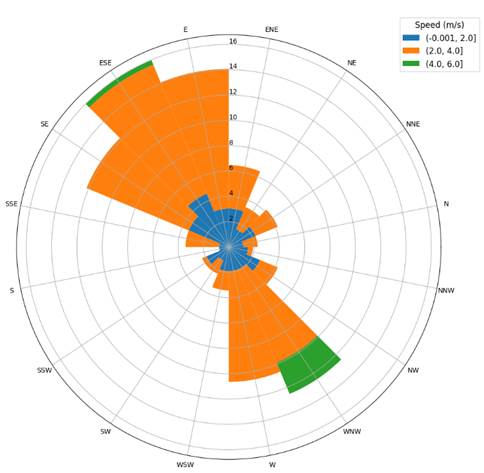
Fig. 11. Distribution of wind direction and wind speed classes at 10 m height (January–July 2025); Source: NASA POWER data [51]
This wind speed class, direction, and distribution pattern support the strategy of implementing small-scale wind turbine systems for independent energy needs in the Bangowan area, noting that energy output will be more stable when combined with other renewable energy sources, such as solar panels.
3.4 Strategy Effectiveness in Addressing Limits and Operational Challenges
The strategies proposed in this study are effective because they combine three key approaches. First, the use of Archimedes turbines has been proven to be suitable for areas with low to moderate wind speeds, so that it can operate stably in Bangowan conditions with an average of 6.04 m.s-1. This addresses the main limitation of conventional turbines that typically require higher wind speeds, as noted by Wijanarko et al.[23], while Wijayanto et al.[24] highlighted design innovations that enhance turbine performance in low-wind regions.
Second, the application of IoT-based monitoring systems such as ThingSpeak enables real-time tracking of turbine performance. Viegas et al.[42] demonstrated the reliability of IoT platforms for handling latency in data transfer, whereas Selvaraj and Selvaraj [50] emphasized the role of IoT in predictive maintenance, ensuring that decreases in efficiency or technical glitches can be detected and addressed before leading to major failures.
Third, the hybrid system configuration strategy (wind turbine + solar panels + backup generator) directly addresses the challenge of intermittent wind energy availability by allowing complementary use of different energy sources. Wijayanto et al. [24] illustrated how integrated turbine design supports hybrid solutions, while Javed et al. [37] explained how hybrid systems with storage reduce risks associated with weather variability, peak demand, and maintenance requirements. Overall, the integration of these three approaches ensures that the proposed strategy is not only technically feasible but also resilient in addressing both operational limitations and long-term energy challenges in rural tourist villages
3.5 Performance Evaluation of Wind Turbine Based on Field Data
This analysis was conducted to assess wind turbine performance by exploring the correlation between wind velocity and TSR and the association between TSR and the Cp. Fig. 12 illustrates the correlation between wind velocity and the TSR.
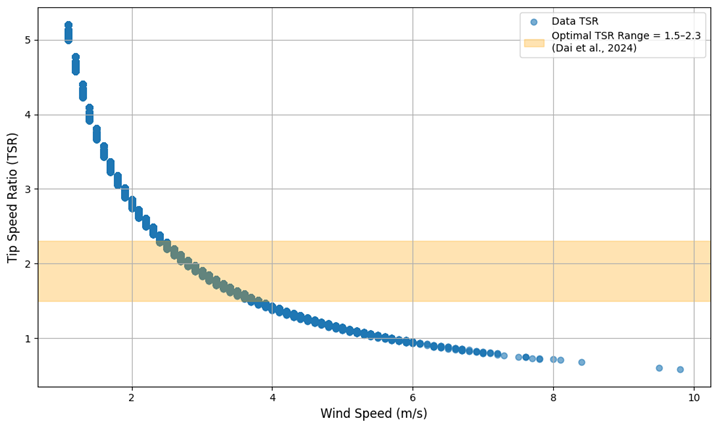
Fig. 12. Graph of Wind Speed and TSR Relationship
The Fig. 12 shows the correlation between wind velocity and the TSR, with the shaded area marking the optimal TSR range of 1.5–2.3 according to [52]. It was seen that the TSR value decreased as wind speeds increased, with most of the data only being in the optimal zone in the range of 2.5 to 4 m.s-1. This shows that operating turbines outside the wind speed range has the potential to reduce energy conversion efficiency, so TSR control is essential to maintain system performance. Simultaneously, the turbine’s efficiency in converting wind kinetic energy to rotor mechanical energy was assessed by analyzing the relationship between TSR and Cp, as shown in Fig. 13.
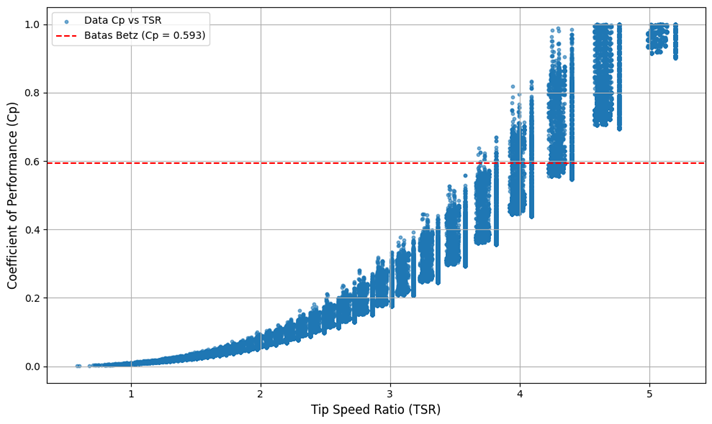
Fig. 13. Cp and TSR Relationship Graph
Fig. 13 shows how TSR variations relate to changes in wind turbine Cp, with the red dashed line marking the Betz theory limit (Cp = 0.593) as referenced in Khan [45]. It can be seen that the Cp value increases as the TSR increases, to the point that it approaches and even appears to exceed the Betz limit at some point. Although theoretically the Cp cannot exceed 0.593, the occurrence of values above that limit is likely due to fluctuations in experimental data, sensor noise, or calculation assumptions that are not entirely ideal. In general, this trend indicates that an increase in TSR positively impacts energy conversion efficiency, but further validation is still needed to ensure that the accuracy of the Cp value is close to the theoretical limit. One of the factors that causes wind turbines not to operate optimally is the low wind speed, which makes the rotor unable to reach the optimal speed [53]. The second factor is the excessive electrical load connected to the turbine, causing the blade rotation speed to decrease so that the TSR becomes lower than optimal [54]. For the turbine to work close to the optimal value, all that needs to be done is to adjust the load or control system of the turbine. Maximum Power Point Tracking (MPPT) can ensure that the turbine continues to work at the optimal TSR because this MPPT system can adjust to excess electrical loads. In addition, optimizing the location and height of the turbine can also make the turbine work at optimal TSR. The higher the turbine, the more likely it is to get wind at a more stable speed, so the optimal TSR is easier to achieve with this Archimedes turbine [55].
A statistical linear regression analysis was carried out to strengthen the findings on evaluating the relationship between TSR and Cp, as presented in Table 4.
Table 4. Statistical analysis of the relationship between Cp and TSR
| Regression Coefficient | B | Std. Error | t | Sig | R | R2 | F |
| (Constant) | -0.592 | 0.002 | -364.924 | 0.000 | |||
| TSR | 0.302 | 0.000 | 677.806 | 0.000 | 0.931 | 0.867 | 459421.125 |
In Table 4, the analysis results show that the relationship between TSR and Cp is substantial and statistically significant, with the value of F(1, 70720) = 459421.125 and p < 0.001.
The linear regression equation is as follows:
| Cp = -0.59 + 0.302. TSR | (5) |
As shown in Eq. (5), a one-unit rise in the TSR leads to an increase of 0.302 in the Cp. This implies that a higher TSR to wind velocity corresponds to a proportionally improved turbine efficiency in converting wind kinetic energy into electrical power (Cp).
An R² value of 0.867 suggests that 86.7% of the variability in Cp can be attributed to variations in TSR, and other factors can explain 13.3%. Some of these different factors include the pitch angle of the bar [56], air density [57], Wind Turbulence [58], and blade aerodynamic design [59].
To determine the efficiency of the Archimedes turbine compared to other turbines intended for low-speed wind, you can see the comparison based on the reference Jha [44] in Fig. 14.
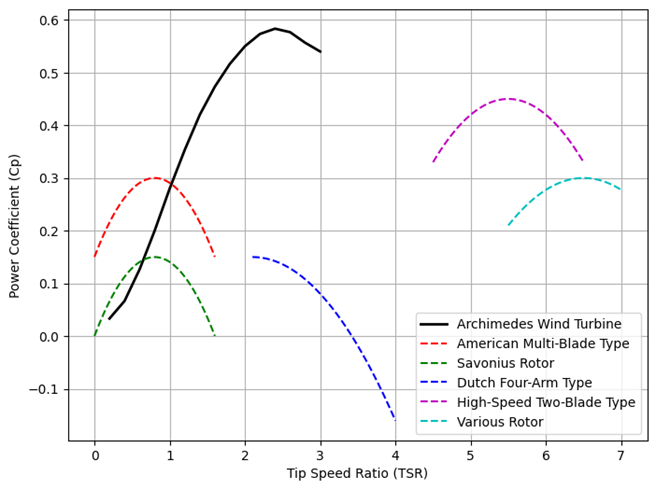
Fig. 14. TSR vs Cp comparison for actual and reference data
Fig. 14 shows the correlation between the TSR and Cp of different types of wind turbines with distinct characteristics. It can be seen that the Archimedes turbine has a maximum Cp value of about 0.59 at a TSR of 2.4, which is close to Betz's theoretical limit of 0.593 [45]. Compared to other low-speed wind turbines, such as the Savonius or American Multi-Blade, which can only reach Cp below 0.3, the Archimedes turbine exhibits much better aerodynamic performance in the low to medium TSR range. Meanwhile, high-speed turbine types such as the High-Speed Two-Blade have high Cp values (~0.4–0.45), operate at a TSR above five, and are unsuitable for areas with low wind speeds. With this in mind, the capacity of Archimedes turbines to achieve high efficiency at low TSRs makes it an ideal choice for rural or remote areas with low average wind speeds. Its efficient performance also shows excellent potential to be applied in distributed generation systems, especially in regions difficult to reach by conventional power grids.
3.6 Assessment of Energy Supply Adequacy for Local Electricity Demand
Next, the adequacy of electrical energy produced from wind turbines will be evaluated, and the energy needed in the location of the tourist village will be compared. The summary of monthly energy can be seen in Table 5.
Table 5: Monthly Energy Summary
| Month | Observation Day | Total Energy (Wh) | Average for the Day (Wh) |
| Februari Maret April | 22 31 30 | 11,931.00 156,922.96 307,436.00 | 542.36 5,062.03 10,247.87 |
Data from February – April 2025 shows a significant increase in daily energy, from 542.36 Wh in February to 10,247.87 Wh in April. The daily average for 83 days reached 5,284.09 Wh. With two turbines, the total energy per day is estimated at 10,568.18 Wh, only sufficient for about 32.95% of the daily needs of tourist villages, which reach 32,075 Wh. This shows that wind-based systems have not been able to fully meet energy needs.
This comparison shows that the current wind turbine system only covers about 32.95% of the village's electricity needs. This means that even though there are two turbine units, the contribution of wind energy is not entirely sufficient. There is still a difference of about 21,506.82 Wh per day that must be met from other sources or the backup system. Several scenarios can be considered to overcome this shortcoming, involving Photovoltaic (PV) panels as an additional renewable sourceas shown in Table 6.
Table 6. Tourist Village Energy Fulfillment Scenario
| Scenario | Total Energy Available (kWh/month) | Adequacy (%) | Keterangan | |
| I | 2 turbines | 317.0 | 32.95 | - Not enough, need additional energy (Investment (IDR 36,000,000) |
| II | 2 turbines + 4 additional turbines | 951.0 | 98.83 | Almost enough, a significant investment (Investment (IDR 108,000,000) |
| III | 2 turbines + 1 kWp + Generator set 3 hours/day | 802.0 | 83.35 | - Almost enough (Investment (IDR 36,000,000 + IDR 5,000,000 + IDR 10,000 = IDR 51,000,000) |
| IV | 2 turbines + 2 kWp PV + Generator set 4 hours/day | 1047.0 | 108.81 | - Sufficient energy (Investment (IDR 36,000,000 + IDR 10,000,000 + IDR 10,000,000 = IDR 56,000,000 |
Notes: IDR = Indonesian Rupiah.
Table 6 summarizes four energy supply scenarios for tourist villages based on total monthly energy, adequacy, and estimated investment. Scenario I only use two turbines with insufficient output (33%, IDR 36 million). Scenario II adds four turbines, increasing sufficiency to 99% with a high investment (±IDR 108 million). Scenario III combines two turbines, a 1 kWp solar panel, and a 3-hour/day generator, achieving 83% sufficiency with a more moderate investment (±IDR 51 million). Scenario IV is the most technically feasible configuration, with two turbines, a 2 kWp PV, and a 4-hour/day generator, resulting in 108.81% energy adequacy with an investment of ±IDR 56 million, making it the most balanced solution. The combination of wind turbines and solar panels is rated as the most realistic alternative. Based on ThingSpeak data and research sites at an altitude of >100 meters above sea level, the potential of sunlight is quite good [37], so that PV integration can cover the energy shortage more stably [55]. This hybrid system is also in line with the development of sustainable energy and independent tourism villages
3.7 Research Implications and Recommendations for Renewable Energy Planning
Based on the feasibility analysis and tested scenarios, employing wind turbines as the primary energy supply shows a significant contribution, but it is not yet fully able to meet the needs without being supported by other sources. Therefore, a hybrid approach combining wind turbines, solar panels, and backup generators is the most realistic option for achieving technical and economic energy sufficiency.
The system configuration in scenario IV, namely two wind turbines, two kWp PV, and a five kVA generator that is on for 4 hours per day, has been proven to be able to meet the full energy needs (108.81%) with a total cost-efficient investment (±Rp 56 million). This design is technically efficient, economical, flexible, and adaptable in various locations. Taking into account the stability of supply and the minimization of operational costs, these results recommend that a "hybrid system with a modular design" consisting of components that can be added or subtracted according to field needs can be the leading solution in the development of renewable energy for tourist areas or remote rural areas. Recommendations for future research include exploring the integration of energy storage technologies, such as batteries, and the potential for financing involving the participation of residents or institutions, to accelerate the implementation of this kind of system.
These findings are in line with the results of a rural electrification study in Nepal, where Sedai et al. [6] reports that self-sustaining wind energy projects are rarely able to meet needs without the support of solar panels and energy storage systems, due to the high variability of resources and capital requirements. This is consistent with the Bangowan case, where two Archimedes turbines could only provide about 10,568 Wh/day equivalent to ~32.95% of the daily electricity demand of 32,075 Wh, showing that wind alone is insufficient. Similarly, in the tourism sector in Zimbabwe, Chiwaridzo [60] emphasizing that the adoption of renewable energy will provide the greatest benefits when integrated with green supply chain management, thereby not only ensuring technical adequacy but also strengthening energy independence and operational resilience. Overall, the two studies show that for a tourist village like Bangowan, a hybrid renewable energy system not only needs to be optimized from a technical point of view, but also needs to be supported by a socio-economic and managerial framework in order for sustainability and scalability to be achieved.
4 Conclusions
This study has analyzed the wind turbine output performance based on actual data obtained from the ThingSpeak platform, focusing on evaluating the correlation between wind velocity, TSR, and Cp. The findings derived from the analysis showed that the wind turbines used had optimal performance at certain TSRs, with an average wind velocity at the study location of 6.04 m.s-1
Regarding energy availability, one turbine unit produced 158.5 kWh of energy per month during the observation period. With two turbines installed, the total energy production reaches around 317 kWh per month, which covers about 33% of the total electricity needs of the tourist villages of 962.25 kWh per month. This indicates that the potential of wind energy at the research site significantly contributes, but has not fully met energy needs independently.
Therefore, based on the performance and technical feasibility study results, the wind turbine system in the Bangowan tourist village can be categorized as technically feasible as a potential replacement for conventional energy systems. To truly achieve energy independence, it is necessary to increase the capacity of the system, one of which is through a configuration as in Scenario IV, namely two wind turbines, two kWp solar panels, and a five kVA generator that is operated 4 hours per day, which in total can produce 1,047 kWh per month, exceeding the needs and ensuring the sustainability of energy supply for electricity operations in the tourist village area.
Future research can take advantage of the continuous IoT-based ThingSpeak monitoring, which is still running, to capture long-term and seasonal variations in wind energy availability. Extending the dataset beyond the initial observation period will allow more accurate modeling of performance trends and reliability. This can also support the optimization of hybrid system configurations for achieving energy independence in tourist villages.
Acknowledgements
No external funding was received.
References
- A. Tola, A. Minga, and E. Muca, “Rural tourism: Nurturing prosperity and community resilience,” Edelweiss Appl. Sci. Technol., vol. 8, no. 3, pp. 279–289, May 2024, doi: 10.55214/25768484.v8i3.968.
- Q. B. Baloch et al., “Impact of tourism development upon environmental sustainability: a suggested framework for sustainable ecotourism,” Environ. Sci. Pollut. Res., vol. 30, no. 3, pp. 5917–5930, Jan. 2023, doi: 10.1007/s11356-022-22496-w.
- C. W. Lu, J. C. Huang, C. Chen, M. H. Shu, C. W. Hsu, and B. R. Tapas Bapu, “An energy-efficient smart city for sustainable green tourism industry,” Sustain. Energy Technol. Assessments, vol. 47, no. July, p. 101494, 2021, doi: 10.1016/j.seta.2021.101494.
- M. Jahangiri, F. Raeiszadeh, R. Alayi, A. Najafi, and A. Tahmasebi, “Development of Rural Tourism in Iran Using PV-Based System: Finding the Best Economic Configuration,” J. Renew. Energy Environ., vol. 9, no. 4, pp. 1–9, 2022, doi: 10.30501/jree.2022.298089.1234.
- A. E. Copping et al., “Enabling renewable energy while protecting wildlife: An ecological risk-based approach to wind energy development using ecosystem-based management values,” Sustain., vol. 12, no. 22, pp. 1–18, 2020, doi: 10.3390/su12229352.
- A. Sedai et al., “Renewable energy resource assessment for rural electrification: a case study in Nepal,” Int. J. Low-Carbon Technol., vol. 18, no. October, pp. 1107–1119, Feb. 2023, doi: 10.1093/ijlct/ctad089.
- G. Ren, J. Wan, W. Wang, J. Liu, F. Hong, and D. Yu, “Quantitative insights into the differences of variability and intermittency between wind and solar resources on spatial and temporal scales in China,” J. Renew. Sustain. Energy, vol. 13, no. 4, Jul. 2021, doi: 10.1063/5.0055134.
- V. Adomavicius, G. Simkoniene, and A. Dedenok, “Usefulness of small-scale stand-alone hybrid solar-wind power plants in rural areas,” May 2024. doi: 10.22616/ERDev.2024.23.TF111.
- S. Ferrari, F. Zagarella, P. Caputo, and M. Beccali, “Mapping Seasonal Variability of Buildings Electricity Demand profiles in Mediterranean Small Islands,” Energies, vol. 16, no. 4, 2023, doi: 10.3390/en16041568.
- O. T. Chiwaridzo, “Harnessing renewable energy technologies for energy independence within Zimbabwean tourism industry: A pathway towards sustainability,” Energy Sustain. Dev., vol. 76, p. 101301, Oct. 2023, doi: 10.1016/j.esd.2023.101301.
- Y. Li, A. A. Nassani, K. M. Al-Aiban, S. ur Rahman, I. Naseem, and K. Zaman, “Beyond the numbers: unveiling the environmental impacts of international tourism and the role of renewable energy transition,” Curr. Issues Tour., vol. 27, no. 22, pp. 3908–3923, Nov. 2024, doi: 10.1080/13683500.2024.2313057.
- F. M. Osorio-Molina, R. Muñoz-Benito, and D. Pérez-Neira, “Empirical evidence, methodologies and perspectives on tourism, energy and sustainability: A systematic review,” Ecol. Indic., vol. 155, p. 110929, Nov. 2023, doi: 10.1016/j.ecolind.2023.110929.
- Y. H. Tehrani and S. M. Atarodi, “Design & implementation of a high precision & high dynamic range power consumption measurement system for smart energy IoT applications,” Measurement, vol. 146, pp. 458–466, Nov. 2019, doi: 10.1016/j.measurement.2019.06.037.
- C. Krishna Rao, S. K. Sahoo, and F. F. Yanine, “IoT enabled Intelligent Energy Management System employing advanced forecasting algorithms and load optimization strategies to enhance renewable energy generation,” Unconv. Resour., vol. 4, no. July, p. 100101, 2024, doi: 10.1016/j.uncres.2024.100101.
- B. Mallala, M. F. N. Tajuddin, S. B. Thanikanti, and R. R. Manyam, “Experimental Analysis using IoT based Smart Power Quality Analyser System with Remote Data Access and GSM Alerting Mechanism,” IEEE Access, vol. 13, no. January, pp. 12921–12935, 2025, doi: 10.1109/ACCESS.2025.3529685.
- S. Verma, Y. L. Kameswari, and S. Kumar, “A Review on Environmental Parameters Monitoring Systems for Power Generation Estimation from Renewable Energy Systems,” Bionanoscience, vol. 14, no. 4, pp. 3864–3888, Nov. 2024, doi: 10.1007/s12668-024-01358-4.
- I. Vairavasundaram, S. K. Ramu, J. P. Stephenraj, O. P. D, and G. C. R. Irudayaraj, “IoT based monitoring system for DFIG based wind turbines under voltage dips,” e-Prime - Adv. Electr. Eng. Electron. Energy, vol. 9, no. March, p. 100690, 2024, doi: 10.1016/j.prime.2024.100690.
- N. Bekirsky, C. E. Hoicka, M. C. Brisbois, and L. Ramirez Camargo, “Many actors amongst multiple renewables: A systematic review of actor involvement in complementarity of renewable energy sources,” Renew. Sustain. Energy Rev., vol. 161, p. 112368, Jun. 2022, doi: 10.1016/j.rser.2022.112368.
- A. Boričić, J. L. R. Torres, and M. Popov, “Comprehensive Review of Short-Term Voltage Stability Evaluation Methods in Modern Power Systems,” Energies, vol. 14, no. 14, p. 4076, Jul. 2021, doi: 10.3390/en14144076.
- M. G. M. Almihat and M. Kahn, “Centralized control system for islanded minigrid,” AIMS Energy, vol. 11, no. 4, pp. 663–682, 2023, doi: 10.3934/energy.2023033.
- A. F. Saleem and M. AlMuhaini, “Reliability assessment of an isolated hybrid microgrid using Markov modeling and Monte Carlo simulation,” Eng. Rev., vol. 41, no. 2, pp. 62–73, 2020, doi: 10.30765/er.1478.
- R. R. Singh, S. Banerjee, R. Manikandan, K. Kotecha, V. Indragandhi, and S. Vairavasundaram, “Intelligent IoT Wind Emulation System Based on Real-Time Data Fetching Approach,” IEEE Access, vol. 10, no. July, pp. 78253–78267, 2022, doi: 10.1109/ACCESS.2022.3193774.
- T. Wijanarko, D. H. Didane, W. Wijianto, M. Al-Ghriybah, N. F. Nasir, and N. M. Isa, “Assessing the Wind Energy Potential in Provinces of West Java, Papua, and East Borneo in Indonesia,” J. Appl. Eng. Sci., vol. 20, no. 4, pp. 1053–1062, 2022, doi: 10.5937/jaes0-35192.
- D. S. Wijayanto, Soenarto, M. B. Triyono, and H. Ibadi, “Double-Stage Savonius and Darrieus Wind Turbines for Urban Areas Using Fiberglass Materials,” J. Appl. Eng. Sci., vol. 20, no. 2, pp. 386–394, 2022, doi: 10.5937/jaes0-33297.
- M. Shalby, A. A. Salah, G. A. Matarneh, A. Marashli, and M. R. Gommaa, “An investigation of a 3D printed micro-wind turbine for residential power production,” Int. J. Renew. Energy Dev., vol. 12, no. 3, pp. 550–559, 2023, doi: 10.14710/ijred.2023.52615.
- M. Shalby, A. Abuseif, M. R. Gomaa, AhmadSalah, A. Marashli, and H. Al-Rawashdeh, “Assessment of Dust Properties in Ma’an Wind Farms in Southern Jordan,” Jordan J. Mech. Ind. Eng., vol. 16, no. 4, pp. 645–652, 2022.
- M. Shalby, M. R. Gomaa, A. Salah, A. Marashli, T. Yusaf, and M. Laimon, “Impact of the Air Filtration in the Nacelle on the Wind Turbine Performance,” Energies, vol. 16, no. 9, 2023, doi: 10.3390/en16093715.
- S. L. Samarasinghe, M. Moghimi, and P. Kaparaju, “A review of modelling tools for net-zero emission energy systems, based on model capabilities, modelling criteria and model availability,” Renew. Energy Focus, vol. 53, 2025, doi: 10.1016/j.ref.2024.100659.
- M. M. Mundu, S. N. Nnamchi, J. I. Sempewo, and D. E. Uti, “Simulation modeling for energy systems analysis: a critical review,” Energy Informatics, vol. 7, no. 1, 2024, doi: 10.1186/s42162-024-00374-8.
- M. Thirunavukkarasu, Y. Sawle, and H. Lala, “A comprehensive review on optimization of hybrid renewable energy systems using various optimization techniques,” Renew. Sustain. Energy Rev., vol. 176, no. January, p. 113192, 2023, doi: 10.1016/j.rser.2023.113192.
- A. Giedraityte, S. Rimkevicius, M. Marciukaitis, V. Radziukynas, and R. Bakas, “Hybrid Renewable Energy Systems—A Review of Optimization Approaches and Future Challenges,” Appl. Sci., vol. 15, no. 4, pp. 1–30, 2025, doi: 10.3390/app15041744.
- P. Blora, “Desa Wisata Bangowan Raih Juara II di ADWI 2024 Kategori Rintisan,” cnnindonesia.com. Accessed: Feb. 03, 2025. [Online]. Available: https://www.cnnindonesia.com/nasional/20241202131215-25-1172834/desa-wisata-bangowan-raih-juara-ii-di-adwi-2024-kategori-rintisan
- Dinkominfo, “Geografi Kabupaten Blora,” blorakab.go.id. Accessed: Feb. 03, 2025. [Online]. Available: https://www.blorakab.go.id/index.php/public/profil/index/164
- P. Bangowan, “Wilayah,” Pemdes Bangowan. Accessed: Mar. 03, 2025. [Online]. Available: https://pemdesbangowan.com/wilayah/
- Blorakab, “LUAS DAN BATAS WILAYAH ADMINISTRATIF.” [Online]. Available: https://www.blorakab.go.id/index.php/public/profil/index/164
- S. S. Dorzhiev and M. I. Rosenblum, “Wind power plant with low-potential wind energy storage in conditions of a shortage of wind power,” 2023, p. 020003. doi: 10.1063/5.0172450.
- M. S. Javed, T. Ma, J. Jurasz, and M. Y. Amin, “Solar and wind power generation systems with pumped hydro storage: Review and future perspectives,” Renew. Energy, vol. 148, pp. 176–192, 2020, doi: 10.1016/j.renene.2019.11.157.
- S. Renke, “Instruction manual of wind speed transmitter (type 485) RS-FSJT-N01 Wind speed transmitter user’s Guide (Type 485),” no. type 485, pp. 1–10, [Online]. Available: www.renkeer.com
- B. Sellers, “KYORITSU SANWA CD 732 digital multimeter Voltmeter Hz Ohm NCV Capacitance Resistance Tester ALL- IN-ONE digital multimeter resistance capacitance, frequency, Product Information Technical Details”.
- “CT6235B User’s Manual Specifications,” New York, 2011. [Online]. Available: www.generaltools.com
- M. Sortino and E. Vaglio, “Automatic classification of smart sensor data for evaluating machine tool efficiency,” Int. J. Adv. Manuf. Technol., vol. 132, no. 11–12, pp. 6085–6100, 2024, doi: 10.1007/s00170-024-13687-5.
- V. Viegas, J. M. D. Pereira, P. Girão, and O. Postolache, “Study of latencies in ThingSpeak,” Adv. Sci. Technol. Eng. Syst. J., vol. 6, no. 1, pp. 342–348, Jan. 2021, doi: 10.25046/aj060139.
- P. Spiru and P. L. Simona, “Wind energy resource assessment and wind turbine selection analysis for sustainable energy production,” Sci. Rep., vol. 14, no. 1, pp. 1–16, 2024, doi: 10.1038/s41598-024-61350-6.
- A. . Jha, Wind Turbine Technology, vol. 59. CRC Press Taylor & Francis Group, 2011. [Online]. Available: http://www.taylorandfrancis.com
- S. Khan, “Conflicts in Betz Limit and An Alternative Approach for Wind Turbines,” 2020 IEEE Reg. 10 Symp. TENSYMP 2020, no. June, pp. 1438–1443, 2020, doi: 10.1109/TENSYMP50017.2020.9230876.
- O. O. Ajayi, O. Ojo, and A. Vasel, “On the need for the development of low wind speed turbine generator system,” IOP Conf. Ser. Earth Environ. Sci., vol. 331, no. 1, 2019, doi: 10.1088/1755-1315/331/1/012062.
- N. K. Siavash et al., “Prediction of power generation and rotor angular speed of a small wind turbine equipped to a controllable duct using artificial neural network and multiple linear regression,” Environ. Res., vol. 196, p. 110434, 2021, doi: 10.1016/j.envres.2020.110434.
- A. Sedaghat, A. Hassanzadeh, J. Jamali, A. Mostafaeipour, and W.-H. Chen, “Determination of rated wind speed for maximum annual energy production of variable speed wind turbines,” Appl. Energy, vol. 205, pp. 781–789, Nov. 2017, doi: 10.1016/j.apenergy.2017.08.079.
- C. Emeksiz, “A novel estimation chart method based on capacity value calculated by using energy pattern factor to determine rated wind speed,” Energy Sources, Part A Recover. Util. Environ. Eff., vol. 44, no. 3, pp. 7268–7286, Sep. 2022, doi: 10.1080/15567036.2022.2107731.
- Y. Selvaraj and C. Selvaraj, “Proactive maintenance of small wind turbines using IoT and machine learning models,” Int. J. Green Energy, vol. 19, no. 5, pp. 463–475, Apr. 2022, doi: 10.1080/15435075.2021.1930004.
- NASA, “NASA Prediction Of Worldwide Energy Resources (POWER) Data Access Viewer,” NASA Langley Research Center. Accessed: Sep. 20, 2025. [Online]. Available: https://power.larc.nasa.gov/
- Y. Dai, Z. Deng, B. Li, L. Zhong, and J. Wang, “Study on the Relationship between Structural Aspects and Aerodynamic Characteristics of Archimedes Spiral Wind Turbines,” Fluid Dyn. Mater. Process., vol. 20, no. 7, pp. 1517–1537, 2024, doi: 10.32604/FDMP.2024.046828.
- Z. Nizamani, A. K. Muhammad, M. O. A. Ali, M. A. Wahab, A. Nakayama, and M. M. Ahmed, “Renewable wind energy resources in offshore low wind speeds regions near the equator: A review,” Ocean Eng., vol. 311, p. 118834, Nov. 2024, doi: 10.1016/j.oceaneng.2024.118834.
- D. Kumar and M. A. Rotea, “Brief communication: Real-time estimation of the optimal tip-speed ratio for controlling wind turbines with degraded blades,” Wind Energy Sci., vol. 9, no. 11, pp. 2133–2146, Nov. 2024, doi: 10.5194/wes-9-2133-2024.
- A. G. Refaie, H. S. Abdel Hameed, M. A. A. Nawar, Y. A. Attai, and M. H. Mohamed, “Qualitative and quantitative assessments of an Archimedes Spiral Wind Turbine performance augmented by A concentrator,” Energy, vol. 231, p. 121128, 2021, doi: 10.1016/j.energy.2021.121128.
- Y. Han and S. Oh, “Effects of the pitch angle control on a Gurney flap-equipped vertical axis wind turbine,” J. Mech. Sci. Technol., vol. 37, no. 8, pp. 4057–4063, Aug. 2023, doi: 10.1007/s12206-023-0722-0.
- H. Suzuki, Y. Hasegawa, O. D. A. Oluwasola, and S. Mochizuki, “Attempt to quantify the impact of seasonal air density variation on operating tip-speed ratio of small wind turbines,” J. Phys. Conf. Ser., vol. 2090, no. 1, p. 012144, Nov. 2021, doi: 10.1088/1742-6596/2090/1/012144.
- B. J. Stanislawski, R. Thedin, A. Sharma, E. Branlard, G. Vijayakumar, and M. A. Sprague, “Effect of the integral length scales of turbulent inflows on wind turbine loads,” Renew. Energy, vol. 217, p. 119218, Nov. 2023, doi: 10.1016/j.renene.2023.119218.
- L. N. Azadani and M. Saleh, “Effect of blade aspect ratio on the performance of a pair of vertical axis wind turbines,” Ocean Eng., vol. 265, p. 112627, Dec. 2022, doi: 10.1016/j.oceaneng.2022.112627.
- O. T. Chiwaridzo, “Harnessing renewable energy technologies for energy independence within Zimbabwean tourism industry: A pathway towards sustainability,” Energy Sustain. Dev., vol. 76, no. July, p. 101301, 2023, doi: 10.1016/j.esd.2023.101301.
Conflict of Interest Statement
The authors declare no conflict of interest.
Author Contributions
Data Availability Statement
The data supporting this study are available in Zenodo at https://doi.org/10.5281/zenodo.15706328
Supplementary Materials
Supplementary Fig.s and raw data are available and can be provided upon request.