Volume 24 number 1 article 1316 pages 72-82
Received: Sep 21, 2025 Accepted: Jan 15, 2026 Available Online: Feb 16, 2026 Published: Mar 02, 2026
DOI: 10.5937/jaes0-61611
PERFORMANCE INVESTIGATION OF SPLIT-WALL AIR CONDITIONING: AN EXPERIMENTAL ANALYSIS OF COP AND EER WITH A CUSTOM DATA LOGGER
Abstract
This investigation presents a comparative performance analysis of inverter and non-inverter air conditioning configurations under tropical climatic conditions, employing a custom-developed data logger system for real-time monitoring. The experimental investigation employed coefficient of performance (COP) and energy efficiency ratio (EER) as primary performance indicators. Both air conditioning configurations were evaluated at a standardized cooling capacity of 2.5 kW to ensure consistent comparative conditions. The experimental setup incorporated a custom-built data logger utilizing an ATmega 2560 microcontroller as the central processing unit, enabling real-time acquisition of thermal and electrical parameters critical for performance evaluation. Comprehensive sensor calibration procedures were conducted to ensure measurement reliability. The DS18B20 temperature sensors underwent rigorous calibration, yielding a mean absolute error (MAE) of ±0.75°C. This result demonstrates a high level of measurement accuracy and complies with established standard calibration acceptance criteria. Quantitative analysis revealed that the inverter system achieved a COP of 4.06, demonstrating 8.6% improvement over the non-inverter system's COP of 3.74. Moreover, the energy efficiency ratio measurements showed the inverter system achieved an EER of 13.8, while the conventional system recorded 12.7, indicating 8.7% improvement. Additionally, the custom data logger demonstrated consistent reliability with multi-parameter measurement capabilities, enabling comprehensive monitoring of essential parameters for HVAC performance.
Highlights
- Custom-built data logger developed with the ATmega 2560 for comprehensive real-time monitoring of thermal and electrical parameters.
- Integration of Multiple Sensors: DS18B20, DHT-22, and PZEM004-T in a Single Microcontroller Unit
- Comparative analysis of inverter and non-inverter air conditioning configurations, involving the coefficient of performance (COP) and the energy efficiency ratio (EER).
Keywords
Content
1 Introduction
Currently, heating, ventilation, and air conditioning (HVAC) systems account for approximately 30% to 60% of total energy consumption in buildings, with refrigeration and air conditioning devices alone consuming about 15% of the world's electrical energy [1], [2]. This substantial energy demand contributes significantly to increased electrical energy consumption patterns globally, making energy efficiency improvements in HVAC systems a critical priority for sustainable building operations. Reducing energy consumption while maintaining effective indoor humidity and temperature control represents a fundamental challenge for modern air conditioning systems. Achieving optimal indoor environmental quality requires balancing energy efficiency with occupant thermal comfort, particularly in regions with extreme climatic conditions [3]. Air conditioning systems typically employ multiple thermodynamic cycles involving heat and mass transfer processes, along with various energy conversion devices. The vapor compression refrigeration cycle remains the most widely implemented technology, particularly in hot and humid climates such as those found in Indonesia and other tropical regions, where maintaining thermal comfort is essential for occupant well-being and productivity. Conventional vapor compression systems operate by cooling air below its dew point temperature to achieve dehumidification, a process that inherently requires substantial energy input [4], [5].
Additionally, these systems contribute to environmental concerns through their potential emissions of greenhouse gases, particularly carbon dioxide (CO2), and the use of refrigerants with high global warming potential (GWP), both of which are significant contributors to climate change [6]. These environmental and energy challenges have motivated extensive research into energy-efficient, low-carbon, and environmentally sustainable air conditioning technologies [7]. Contemporary air conditioning systems increasingly incorporate advanced technologies designed to address electrical energy consumption issues, with inverter technology representing one of the most significant innovations in this field. Inverter technology enhances system efficiency by enabling variable-speed compressor operation, which allows for precise capacity modulation based on actual cooling demand [8], [9]. This approach replaces the traditional binary on/off cycling with continuous operation at varying speeds, resulting in improved energy performance. The benefits of inverter-equipped air conditioning systems include extended equipment lifespan due to reduced mechanical stress, enhanced temperature regulation through precise capacity control, improved humidity management, and substantial energy savings compared to conventional fixed-speed systems.
Shaik et al. [10] developed a non-conventional air conditioning unit consisting of a DCHE for dry environment applications and humid weather conditions. The air conditioning unit generates supply air at 16°C and 60% relative humidity (RH). A low-grade heat source was employed, with a temperature range of 30 to 60°C, to regenerate the DCHEs. The results found in this study include relative humidity effectiveness, electrical COP, and thermal COP, which show values of 0.80, 53, and 0.42, respectively. Sumeru et al. [11] studied the use of condensate produced by the evaporator to decrease the compressor discharge temperature. The research utilized a central air conditioning system with direct expansion (DX), using R22 and having a 25 HP compressor. The results demonstrate that the cooling capacity enhances by about 5.7%, and the COP improves by approximately 9.8%, increasing from 2.5 to 2.8. Martínez et al. [12] conducted a study on the evaporative pre-cooling of a split-type solar air conditioning unit. The results demonstrate a reduction of up to 6°C in the air inlet temperature to the condenser, and the evaporative pad achieved an average efficiency of evaporative cooling of 𝜀evap = 67.4 %. A study by Chen et al. [13] employed condensate to enhance the performance of split air conditioning using the evaporative cooling method. The study demonstrated an average increase in refrigerating capacity of 3.2% by reducing the air temperature, a reduction in power consumption of about 3.0%, and an increase in the energy efficiency ratio of 6.8%. Bohara et al. [14] developed model predictive control (MPC) for residential split air conditioning. This research utilized MPC to control and predict the performance of a 1.5-ton inverter-based air conditioning unit. The results show that adaptive MPC can save over 7.06% energy compared to regular air conditioning operation, which operates at a constant 24°C.
Numerous scholars have conducted research on air conditioning performance metrics using various modification methods to improve system efficiency. These methods can effectively enhance air conditioning performance however, they often involve high costs and complex installation processes, potentially creating inconvenient maintenance problems. Additionally, fewer researchers have conducted studies focusing on real-time control systems for residential split air conditioning units, and existing methods are far from being affordable for widespread adoption. Therefore, this research investigates both inverter and non-inverter air conditioning systems utilizing a custom data logger built from microcontrollers for data acquisition to address issues such as high cost, inconvenient installation, and large space requirements. The research aims to provide a comprehensive thermodynamic investigation including coefficient of performance (COP) and energy efficiency ratio (EER), both of which serve as fundamental parameters for determining system efficiency, energy consumption characteristics, and overall operational reliability. The novelty and contribution of this research lie in the development of an affordable and reliable custom-built data logger that integrates microcontrollers and sensors into a single device. This device can be directly connected to air conditioning systems, enabling accurate and real-time performance analysis. Additional advantages of this device include the ability to combine multiple types of sensors, allowing for comprehensive data collection across various parameters. The recording interval for data retrieval is adjustable, providing flexibility in monitoring different operating conditions. Furthermore, the portable design of the device facilitates investigations of HVAC units in diverse environments, making it suitable for both field and laboratory settings. By minimizing reliance on conventional methods, the data logger significantly reduces the potential for human error during investigations. This innovation not only enhances the efficiency of performance analysis but also contributes to more informed decision-making in HVAC system management. In addition, the findings of this research contribute to a deeper understanding of both inverter and non-inverter air conditioning systems integrated with custom-built data loggers, potentially leading to more efficient and cost-effective cooling solutions for residential applications.
2 Materials and methods
2.1 Experimental design and instrumentation setup
This experimental investigation conducted a comprehensive comparative performance analysis of two split-wall air conditioning systems with identical cooling capacities but different compressor control technologies. Both test units were rated at 2.5 kW cooling capacity and utilized R410A refrigerant, ensuring consistent thermodynamic properties and operating characteristics for valid performance comparison. The system configurations included one inverter-driven variable frequency drive (VFD) unit and one conventional non-inverter fixed-speed unit, representing current residential air conditioning technology variants. The detailed specifications of the inverter and non-inverter air conditioning configurations are shown in Table 1. The experimental testing was conducted in a controlled office environment within the Mechanical Engineering Department at Bali State Polytechnic. The office has an area of 15 m2 and a volume of 37.5 m3 (ceiling height: 2.5 m). The occupancy of this office is 2-3 persons. The external walls are made of concrete with a plaster finish (U-value ), and a single-glazed window of 0.6 m² is installed in the building (U-value ). This facility provides a representative real-world testing environment with typical office thermal loads and occupancy patterns.
Fauzun et al. [15], discuss the effect of air barrier height inside the air conditioning ducting, which is an important factor to consider for air conditioning installation in an office room. The study involved simulating five different heights of air barriers within the supply ducts Despite the study primarily focusing on numerical analysis, it still provides valuable insights into the HVAC field, particularly regarding air conditioning systems. Understanding the impact of air barrier height can significantly enhance the efficiency and effectiveness of air distribution within an office space, ultimately contributing to improved comfort and energy savings. Therefore, incorporating the findings from this study can lead to better-informed decisions when setting up air conditioning systems in an office environment, as demonstrated by the current research conducted by the authors. This knowledge not only enhances the effectiveness of air conditioning installations but also contributes to long-term operational savings and a healthier indoor environment for employees.
The conditioned space is characterized by a calculated cooling load of 2.5 kW, generated primarily by sensible heat sources, including a desktop computer and monitor, laptop, router, printer, lighting systems, and heat gains from the building envelope. A split-wall air conditioning unit was positioned on the west side of the main office. This cooling load magnitude corresponded directly to the rated capacity of both test units, enabling performance evaluation under design operating conditions.
Table 1. Air conditioning system configuration details
|
Inverter |
Non-Inverter |
|||
|
Unit |
Values |
Unit |
Values |
|
|
Cooling capacity |
kW |
2,5 |
kW |
2,5 |
|
Max. current |
A |
8,0 |
A |
5,3 |
|
Power supply |
V |
220-240 |
V |
220-240 |
|
Design pressure (Hi/Lo) |
MPa |
4,1 / 2,2 |
MPa |
4,1 / 2,7 |
|
Input power |
kW |
0,6 |
kW |
0,819 |
|
Fuse amp. |
A |
10 |
A |
15 |
|
Refrigerant |
R410A |
R410A |
||
The ambient environmental conditions during testing were representative of Indonesia's tropical climate characteristics, with the investigation conducted during the summer season when cooling demands are typically at their peak. This timing ensured that the air conditioning systems operated under realistic high-load conditions, providing performance data applicable to actual residential and commercial applications in tropical regions. Furthermore, the experimental investigation focused on comprehensive monitoring of both thermal and electrical performance parameters essential for complete system characterization. Thermal measurements included indoor air temperature and relative humidity at both return air and supply air locations, enabling determination of cooling capacity and humidity control effectiveness. Electrical performance monitoring included current, voltage, and power consumption measurements for both air conditioning units throughout the testing period. These electrical parameters enabled direct calculation of energy consumption rates and provided the foundation for determining system efficiency metrics. The simultaneous measurement of thermal and electrical parameters allowed for comprehensive evaluation of the relationship between energy input and cooling output, which is fundamental to performance analysis of vapor compression refrigeration systems.
Table 2. Detailed configuration of the microcontroller unit
|
Specification |
Details |
|
Microcontroller Type |
ATmega 2560 |
|
Input Voltage |
7V - 12V |
|
Operating Voltage |
5V |
|
Analog Input Pins |
16 |
|
DC Current per Input/Output Pin |
20 mA |
|
Digital Input/Output Pins |
54 |
|
DC current for 3.3V pin |
50 mA |
|
SRAM |
8 KB |
|
Communication interfaces |
UART (4), I2C, SPI |
|
USB connection |
Type B USB port |
The comprehensive measurement of thermal and electrical parameters provided the necessary data for calculating key performance indicators, specifically the coefficient of performance (COP) and energy efficiency ratio (EER). These performance metrics were calculated using measured cooling capacity derived from air-side enthalpy differences and measured electrical power consumption. The simultaneous measurement approach ensured that COP and EER values reflected actual system performance under identical operating conditions, enabling valid comparison between inverter and non-inverter technologies. A custom data logger system was developed using an ATmega 2560 microcontroller as the central processing unit for real-time measurement and logging in this research. The detailed microcontroller specifications are shown in Table 2 [16]. Programming was implemented using Arduino IDE with C++ language, providing seamless integration with peripheral sensors and actuators for comprehensive data collection. The return and supply indoor air temperatures were measured using DS18B20 digital temperature sensors. These sensors feature configurable resolution (9-12 bits), operational temperature range of -50°C to 125°C, and measurement accuracy of ±0.5°C [17], [18]. Each sensor contains a unique 64-bit ROM identifier, enabling multiple-sensor deployment on a single communication bus without addressing conflicts. Then, the air velocity measurements were conducted using a calibrated digital anemometer. Ambient relative humidity was monitored using DHT22 sensor modules, which incorporate precision thermistors and capacitive humidity sensors with 2-second temporal resolution and high accuracy performance [19]. Moreover, the electrical measurements were acquired using PZEM-004T modules with three-digit resolution. The modules feature integrated current transformers (CT) with measurement capability from 0-100 A, providing real-time monitoring of system electrical performance in amperes, volts, watts, and kilowatt-hours. The experimental setup is illustrated in Fig. 1. Testing was conducted with the air conditioning system set to 18°C, while door and windows remained closed to maintain controlled environmental parameters throughout the measurement period.
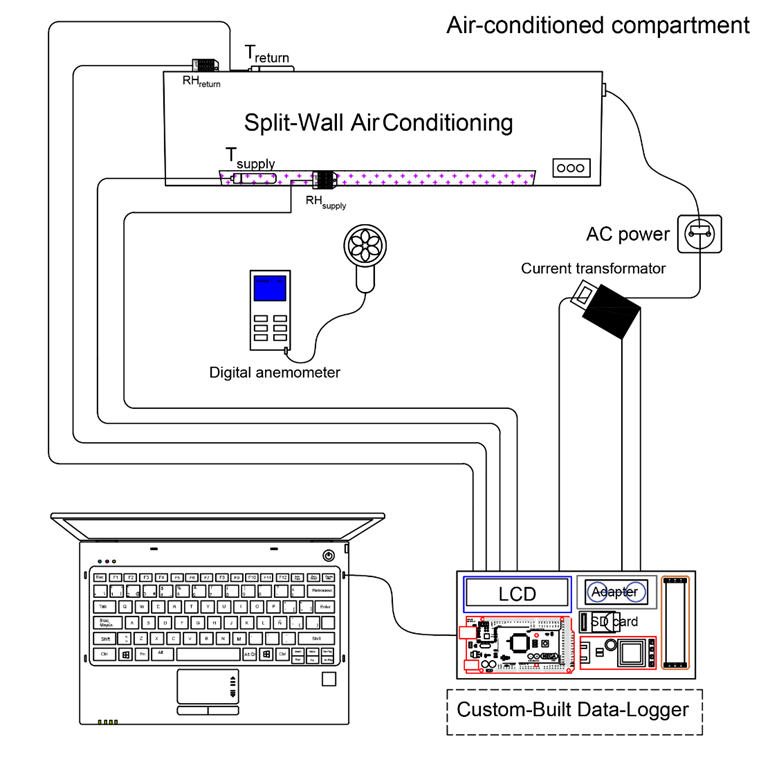
Fig. 1. Schematic of the experimental setup
This research utilized several parameters to determine the performance of the air conditioning system, including volumetric flow rate , mass flow rate , total cooling capacity , coefficient of performance (COP), and energy efficiency ratio (EER). The volume and mass flow rates are determined from Eqs. 1-2.
| \[\dot{V}=v\times A\] | (1) |
| \[\dot{m}=\rho\times\dot{V}\] | (2) |
Where is the fan velocity (m/s), represents the cross-sectional area of the evaporator fan (m2), and represents the air density (kg/m3). The total cooling capacity is determined from Eq. 3
| \[Q_t=\dot{m}\times(h_{in}-h_{out})\] | (3) |
where is the mass flow rate of the refrigerant (Kg/s), is the enthalpy enter the evaporator (kJ/kg), and is the enthalpy leaving the evaporator (kJ/kg). The coefficient of performance (COP) and energy efficiency ratio (EER) is determined from Eqs.4-5
| \[COP=\frac{Q_t}{P}\] | (4) |
| \[EER=COP\times3,421\] | (5) |
where represents the power consumption of the air conditioning unit (kW).
2.2 Temperature sensor calibration procedures
Prior to experimental implementation, all DS18B20 temperature sensors underwent rigorous calibration procedures to ensure measurement accuracy and data reliability. The calibration process was conducted using a controlled water bath system within a glass vessel, providing uniform temperature distribution and thermal stability. A four-point calibration protocol was established with reference temperatures at 25°C, 50°C, 75°C, and 100°C, covering the expected operational temperature range of the air conditioning system. These calibration points were selected to encompass the typical evaporator temperature variations and provide adequate resolution across the measurement spectrum. Temperature reference measurements were obtained using a calibrated Type K thermocouple with an operational range of -200°C to 1372°C and traceable accuracy standards. The reference thermocouple was positioned in close proximity to each DS18B20 sensor to minimize spatial temperature variations and ensure accurate comparative measurements. Calibration accuracy was quantitatively assessed using the Mean Absolute Error (MAE) statistical method, calculated according to Eq. 6 [20]. This approach provided comprehensive evaluation of sensor performance characteristics and established measurement uncertainty bounds for subsequent data analysis. The MAE analysis enabled determination of systematic bias and random error components, facilitating correction factor implementation where necessary.
| \[MAE=\ \frac{1}{n}\sum_{i}^{n}\left|T_{sensor,i}-T_{ref,i}\right|\] | (6) |
Where represents the DS18B20 sensor reading prediction, and represents the corresponding temperature reference measurement. The calibration procedure generated sensor-specific correction coefficients that were programmed into the data logger system, ensuring real-time accuracy enhancement during experimental measurements. This calibration methodology established metrological traceability and provided confidence intervals for all temperature-dependent performance calculations.
3 Results and discussion
3.1 MAE assessment for DS18B20 temperature sensors
Table 3 shows the calibration of the DS18B20 temperature sensor using MAE analysis across four discrete calibration setpoints. The experimental protocol employed triplicate measurements at each calibration point (25°C, 50°C, 75°C, and 100°C) to reduce measurement uncertainty and improve statistical reliability. MAE was calculated as the arithmetic mean of the absolute differences between measured and reference temperature values, providing a quantitative assessment of sensor accuracy. The calibration results demonstrate that both DS18B20 sensors (X1 and X2) exhibit low MAE result values, indicating high measurement accuracy. Sensor X1 achieved an MAE of 0.32°C, while sensor X2 demonstrated better performance with an MAE of 0.27°C. These values were evaluated against the predetermined acceptance criterion of ±0.75°C maximum tolerance, which represents the acceptable deviation threshold for this temperature measurement application.
Table 3. DS18B20 MAE analysis
|
Calibration point |
Reference Temp. (°C) |
Sensor X1 Avg. (°C) |
Absolute Error X1 |
Sensor X2 Avg. (°C) |
Absolute Error X2 |
|
1 |
25 |
24,9 |
0,1 |
24,7 |
0,3 |
|
2 |
50 |
49,5 |
0,5 |
50,2 |
0,2 |
|
3 |
75 |
75,4 |
0,4 |
74,8 |
0,2 |
|
4 |
100 |
100,3 |
0,3 |
100,4 |
0,4 |
|
Mean Absolute Error (MAE) |
0,32°C |
|
0,27°C |
||
Both sensors satisfied the calibration acceptance criteria, as their respective MAE values fell within the established tolerance limits of ±0.75°C. The marginally better performance of sensor X2 can be attributed to reduced measurement error, particularly evident at calibration point 2 (50°C). In temperature measurement systems, lower MAE values correlate directly with improved sensor precision and measurement reliability. In addition, the calibration validation confirms that both DS18B20 sensors are suitable for the HVAC application, demonstrating acceptable accuracy and precision characteristics. The sensors' performance consistency across the tested temperature range from 25°C to 100°C indicates their suitability for reliable temperature monitoring within the specified operational parameters. These results establish confidence in the sensors' metrological performance and their compliance with the established calibration standards.
3.2 Indoor air temperature
The indoor air temperature of the inverter air conditioning is shown in Fig. 2. The analysis encompasses both return air temperature and supply air temperature measurements at the evaporator unit to characterize the system's performance characteristics. From the investigations, it can be seen that the supply air temperature sharply decreases to 18.5°C at around 1200 s following system startup, indicating the initial cooling capacity establishment. Subsequently, the temperature continued to decrease gradually to 17.5°C, with minor fluctuations attributed to variations in the office space cooling load demand. These temperature oscillations reflect the inverter system's variable-capacity operation in response to thermal load changes, demonstrating the system's ability to modulate refrigerant flow and compressor speed to maintain desired indoor conditions [21]. On the other hand, the return air temperature initiated at 27.7°C, representing the initial ambient conditions within the conditioned space. A gradual decrease to 26.7°C was observed at approximately 2000 s, after which the temperature remained relatively stable throughout the remainder of the experimental period. This gradual temperature reduction indicates the progressive cooling of the indoor environment and the approach toward thermal equilibrium between the cooling capacity and space heat gain. In this condition, the inverter air conditioning system operates on the vapor-compression refrigeration cycle, where sensible and latent heat from the conditioned space facilitates the evaporation of liquid refrigerant within the evaporator coils.
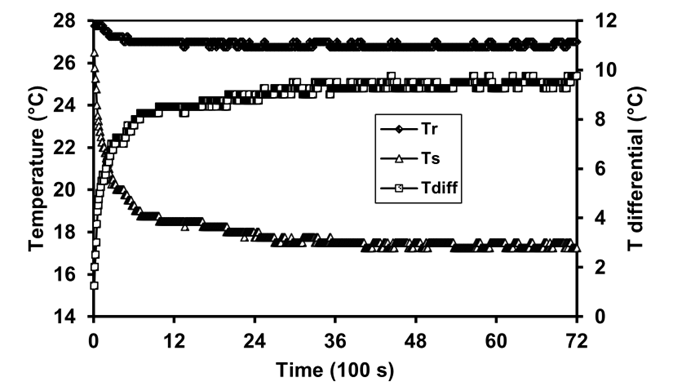
Fig. 2. Indoor air temperature of a 2.5 kW inverter air conditioning system
This endothermic phase-change process results in refrigerant superheating upon exit from the evaporator, consequently reducing the supply air temperature to 17.5°C. The superheated refrigerant vapor is subsequently compressed, elevating both pressure and temperature, before entering the condenser where heat rejection to the ambient environment occurs, completing the thermodynamic cycle. Fig. 2 also shows the temperature differential between the return and supply temperatures. The temperature differential serves as a critical performance indicator for evaporator heat transfer effectiveness. From the observation, it can be seen that the temperature differential significantly increases to 7.5°C at around 1200 s, followed by a further increase to 9.5°C during the experimental duration. The industry standard temperature differential for residential air conditioning applications is approximately 8°C, which serves as a benchmark for evaluating system performance and heat exchange efficiency [22]. However, the measured temperature differential of 9.5°C exceeds the standard reference value, indicating satisfactory evaporator performance and adequate heat transfer capability. This result confirms that the inverter air conditioning system shows acceptable thermal performance characteristics, with the evaporator effectively removing sensible heat from the return airstream.
Fig. 3 shows the indoor air temperature of non-inverter air conditioning. It can be seen that the supply air temperature significantly drops to 19°C at around 1700 s. This temperature response pattern demonstrates similar behavior to that observed in inverter air conditioning systems during the initial cooling phase. Subsequently, the supply air temperature continued to decrease gradually throughout the remainder of the experimental investigation, achieving a minimum value of 18.7°C at approximately 5100 s. This result is about 8.7% higher compared to the supply air temperature of the inverter air conditioning. On the other hand, the return air temperature initiated at 27°C and demonstrated minor fluctuations throughout the test period. Notably, this initial return air temperature was marginally lower than the 27.7°C recorded for the inverter air conditioning system. This temperature differential can be attributed to variations in ambient weather conditions and microclimate fluctuations during the respective testing periods, which influenced the baseline thermal conditions of the conditioned space prior to system operation.
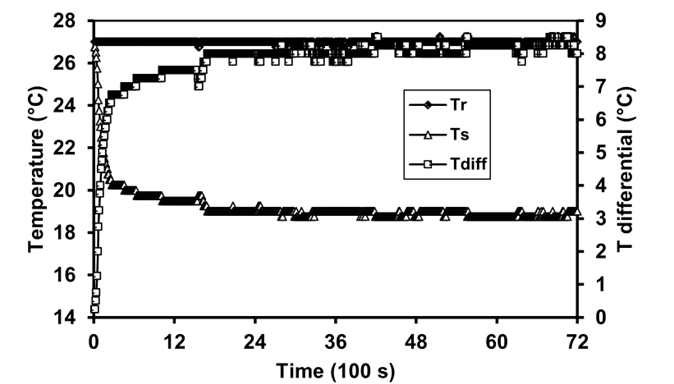
Fig. 3. Indoor air temperature of a 2.5 kW non-inverter air conditioning system
The temperature differential analysis also shown in Fig. 3, reveals that the non-inverter system experienced an initial increase in temperature differential as the supply air temperature decreased. At approximately 1000 s, the temperature differential stabilized at 7.5°C and maintained consistently elevated values throughout the experimental duration. The maximum temperature differential achieved was 8.5°C, indicating effective heat transfer performance. This peak value meets and exceeds standard temperature differential benchmarks for residential air conditioning systems, confirming that the non-inverter unit demonstrates adequate heat removal capacity. A comparative analysis indicates a difference of 11.7% in the peak temperature differential between the inverter and non-inverter air conditioning systems. However, both systems-maintained temperature differentials above the minimum threshold required for effective cooling operation. In addition, larger temperature differentials correspond to more efficient evaporative cooling processes within the evaporator coil, subsequently enhancing the overall cooling capacity and thermal performance of the air conditioning system.
3.3 Electrical analysis
The electrical current of the inverter air conditioning unit is shown in Fig. 4. During the initial startup phase, both systems exhibited significant current surges at approximately 240 seconds into the test cycle. The inverter air conditioning unit reached a peak current of 3.02 A, while the non-inverter unit demonstrated a higher surge of 4.06 A. This initial current spike is characteristic of compressor motor startup behavior, where the motor draws substantially higher current to overcome static friction and initiate rotation. Following the startup transient, both systems demonstrated a gradual increase in current consumption as they approached steady-state operation. The inverter unit stabilized at approximately 3.5 A, while the non-inverter system reached 4.08 A. The consistently higher current consumption observed in the non-inverter air conditioning unit compared to the inverter system can be attributed to fundamental differences in compressor control technology. The inverter-driven system employs variable frequency drive (VFD) technology to modulate compressor speed according to cooling demand, enabling the compressor to operate at optimal efficiency points. This speed control capability results in reduced electrical power consumption during partial load conditions, as the system can reduce compressor speed rather than cycling on and off.
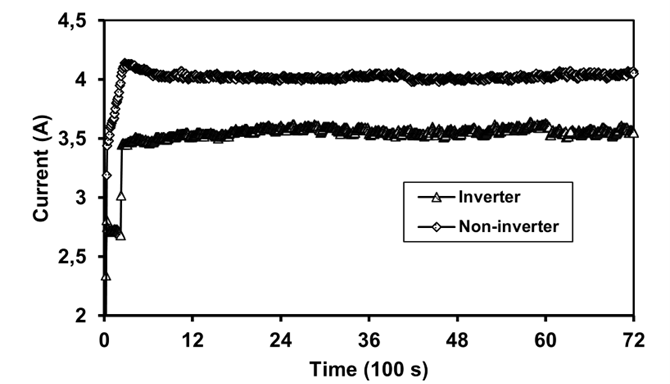
Fig. 4. Electrical current usage in a 2.5 kW air conditioning system
Fig. 5 demonstrates the power consumption of inverter and non-inverter air conditioning systems. During the initial startup phase, both systems demonstrated substantial power consumption increases consistent with the compressor motor initiation sequence. At approximately 272 seconds, the inverter system reached an initial power draw of 492 W, while the non-inverter system consumed significantly higher power at 780 W. This 58.5% difference in startup power consumption reflects the inherent efficiency advantages of variable frequency drive technology during transient operating conditions. As the systems transitioned to steady-state operation, power consumption continued to increase for both configurations. The inverter system stabilized at 637 W, while the non-inverter system reached a maximum consumption of 858 W. The consistently higher power demand observed in the non-inverter system can be attributed to its fixed-speed compressor operation, which requires the compressor to operate at full capacity regardless of instantaneous cooling load requirements. The elevated power consumption of the non-inverter system demonstrates its adherence to design specifications for a rated cooling capacity of 2.5 kW. However, this fixed-capacity operation results in inherent inefficiencies during periods of reduced cooling demand, as the system cannot modulate its power consumption to match actual load requirements. The compressor must cycle on and off to maintain temperature setpoints, leading to frequent startup transients and associated power surges [23].
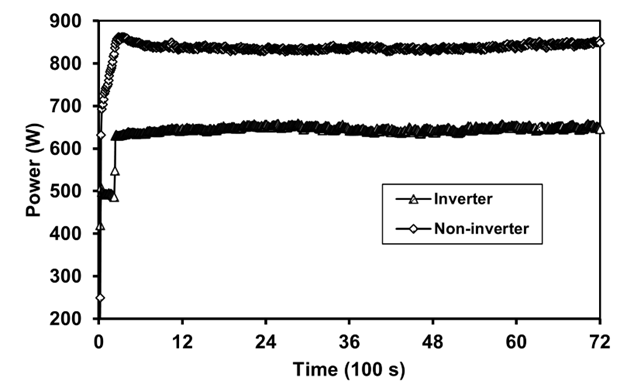
Fig. 5. Power consumption in a 2.5 kW air conditioning system
In contrast, the inverter air conditioning system employs advanced variable frequency drive technology that enables precise modulation of compressor rotational speed. This speed control capability allows the system to match power consumption directly with cooling load demand, eliminating the need for frequent on-off cycling and reducing overall energy consumption. The inverter technology continuously adjusts compressor speed to maintain desired temperature conditions while minimizing power draw. Moreover, the experimental results demonstrate significant energy efficiency improvements achieved through inverter technology implementation. The mean power consumption of the inverter system was 641,7 W, representing a 23.2% reduction compared to the non-inverter system's average consumption of 835,1 W. This substantial power reduction leads to proportional decreases in operational energy costs and reduced environmental impact through lower electrical grid demand. In addition, the energy savings become particularly pronounced during partial load operations, which represent the majority of typical residential air conditioning duty cycles, making inverter technology a critical advancement for sustainable cooling applications.
3.4 Coefficient of performance (COP) and energy efficiency ratio (EER) analysis
Fig. 6 presents a comprehensive comparison of the coefficient of performance (COP) and energy efficiency ratio (EER) for both inverter and non-inverter air conditioning systems. These performance metrics serve as fundamental indicators of thermodynamic efficiency and energy utilization effectiveness in vapor compression refrigeration cycles. The experimental results demonstrate that the inverter air conditioning system achieved a COP of 4.06, while the non-inverter system recorded a COP of 3.74. Both values fall within the theoretical range of 3.0 to 4.0 typically observed for residential air conditioning applications, confirming the systems' adherence to established performance standards [24], [25]. The 8.6% higher COP exhibited by the inverter system indicates superior thermodynamic efficiency compared to the conventional non-inverter configuration. The coefficient of performance is fundamentally governed by several thermodynamic and operational parameters, including refrigerant enthalpy differentials across system components, refrigerant mass flow rates, volumetric flow characteristics, and electrical power consumption. The COP represents the ratio of useful cooling effect to the electrical energy input, making it a critical measure of system efficiency. Higher COP values correspond to enhanced system performance, as they indicate greater cooling output per unit of electrical energy consumed.
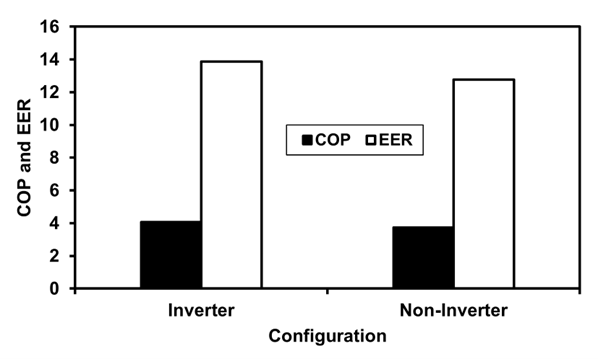
Fig. 6. COP and EER in a 2.5 kW air conditioning system
The remarkable COP performance of the inverter system can be attributed to its optimized operational characteristics. The reduced current consumption and lower power demand previously discussed enable the inverter system to maintain effective cooling capacity while minimizing energy input. Additionally, the inverter system's ability to achieve lower supply air temperatures through variable compressor speed control contributes to improved heat transfer effectiveness, ultimately resulting in enhanced coefficient of performance. The energy efficiency ratio measurements, also presented in Fig. 5, demonstrate a direct proportional relationship with the COP values. The inverter air conditioning system achieved an EER of 13.8, while the non-inverter system recorded an EER of 12.7. This 8.7% improvement in EER for the inverter system correlates directly with the observed COP enhancement, confirming the consistency of performance measurements across different efficiency metrics [26]. The EER serves as a standardized measure of cooling efficiency under specific operating conditions. For residential air conditioning systems with a 2.5 kW cooling capacity, the acceptable EER range is established between 9.0 and 14.0. Both tested systems demonstrate EER values well within this acceptable range, with the inverter system approaching the upper performance threshold. The correlation between COP and EER values validates the thermodynamic consistency of the experimental measurements and confirms that both efficiency metrics respond similarly to system design improvements. The higher EER achieved by the inverter system reflects its enhanced ability to convert electrical energy into useful cooling effect, demonstrating the quantifiable benefits of variable frequency drive technology in residential cooling applications.
4 Conclusions
This experimental investigation conducted a comparative performance analysis of inverter and non-inverter air conditioning systems. The primary contribution presented in this study was a custom-built data logger system based on the Arduino ATmega 2560 microcontroller platform, designed to facilitate comprehensive real-time monitoring of thermal and electrical parameters during the testing period. The custom data logger exhibited exceptional reliability and measurement compatibility throughout the experimental investigation. The architecture of the system incorporates multiple sensor interfaces, enabling the simultaneous measurement of critical parameters, including temperature, relative humidity, current, and power consumption, which are essential for a thorough performance evaluation. Moreover, the data retrieval recording interval is configurable, allowing for increased adaptability in monitoring various operating conditions. The calibration validation process yielded mean absolute error (MAE) values well within the established tolerance limits of ±0.75°C for all temperature sensors, confirming high measurement accuracy and satisfying standard calibration acceptance criteria. The custom data logger system operated continuously without failure throughout the investigation period, providing uninterrupted real-time measurement data at predetermined sampling intervals. The microcontroller-based platform proved to be a cost-effective and robust solution for multi-parameter monitoring in HVAC performance research applications.
The coefficient of performance analysis revealed significant differences between the two system configurations. The inverter air conditioning system achieved a COP of 4.06, representing an 8.6% improvement over the non-inverter system's COP of 3.74. Corresponding energy efficiency ratio measurements demonstrated consistent performance trends. The inverter system recorded an EER of 13.8, while the non-inverter system achieved 12.7, representing an 8.7% improvement for the inverter configuration. The experimental results provide quantitative validation of the performance advantages offered by inverter air conditioning technology in residential cooling applications. Both systems demonstrated acceptable performance characteristics according to established industry standards, ensuring reliable cooling capacity and energy efficiency. However, the consistent 8-9% improvement in both COP and EER metrics for the inverter system represents significant potential for energy savings and reduced operational costs in real-world applications.
Acknowledgements
The authors gratefully acknowledge the financial support received from the Directorate of Research and Community Service (Direktorat Penelitian dan Pengabdian kepada Masyarakat), Directorate General of Research and Development (Direktorat Jenderal Riset dan Pengembangan), Ministry of Education, Culture, Research, and Technology of the Republic of Indonesia (Kementerian Pendidikan Tinggi, Sains, dan Teknologi Indonesia).
References
- C. Chen, H. Yang, X. Li, L. Chen, and M. Shi. (2024). Optimization of solar and heat pump complementary powered desiccant air conditioning system. Journal of Building Engineering, vol. 87, no. March, p. 109084. doi: 10.1016/j.jobe.2024.109084.
- Y. Zhang, J. Xiong, G. Mao, and J. Li. (2024). Ideal mass transfer cycle and thermal performance optimization for liquid desiccant air conditioning system. Results in Physics, vol. 57, no. August 2023, p. 107343. doi: 10.1016/j.rinp.2024.107343.
- M. Dai, H. Li, X. Li, and S. Wang. (2024). Reconfigurable supply-based feedback control for enhanced energy flexibility of air-conditioning systems facilitating grid-interactive buildings. Advances in Applied Energy, vol. 14, no. April, p. 100176. doi: 10.1016/j.adapen.2024.100176.
- M. Hamed Alhamdo, M. Abdulwahed Theeb, and J. Jaber Abdulhameed. (2018). Performance Improvement of an Air-Conditioning System During Refrigerant Evaporation. Journal of Engineering and Sustainable Development, vol. 2018, no. 06, pp. 101–113. doi: 10.31272/jeasd.2018.6.9.
- A. Andrade, J. Zapata-mina, and A. Restrepo. (2024). Exergy and environmental assessment of R-290 as a substitute of R-410A of room air conditioner variable type based on LCCP and TEWI approaches. Results in Engineering, vol. 21, no. November 2023, p. 101806. doi: 10.1016/j.rineng.2024.101806.
- L. Ge, Y. Gao, and X. Meng. (2024). Employing the spray system to alleviate the thermal action of air-conditioning in summer. Case Studies in Thermal Engineering, vol. 55, no. February, p. 104133. doi: 10.1016/j.csite.2024.104133.
- C. Liang, F. Zha, and X. Li. (2024). Low-grade energy-bus air conditioning system using energy efficient three-fluid heat exchange terminals. Next Energy, vol. 3, no. October 2023, p. 100098. doi: 10.1016/j.nxener.2024.100098.
- Á. Andrade, Á. Restrepo, and J. E. Tibaquirá. (2021). EER or Fcsp: A performance analysis of fixed and variable air conditioning at different cooling thermal conditions. Energy Reports, vol. 7, pp. 537–545. doi: 10.1016/j.egyr.2020.12.041.
- A. Esmaeel, A. Rahimnejad, and S. A. Gadsden. (2021). Home energy management system for smart buildings with inverter-based air conditioning system. International Journal of Electrical Power and Energy Systems, vol. 133, no. August 2020, p. 107230. doi: 10.1016/j.ijepes.2021.107230.
- G. A. Shaik, M. Matuszczak, D. Pandelidis, and M. K. Jagirdar. (2025). Performance evaluation of a non-conventional air-conditioner comprising of desiccant-coated heat exchangers and a dew-point cooler for museums. International Communications in Heat and Mass Transfer, vol. 162, p. 108663. doi: 10.1016/J.ICHEATMASSTRANSFER.2025.108663.
- K. Sumeru et al. (2024). Performance evaluation of a central air conditioning system using condensate as a discharge line cooler. Case Studies in Thermal Engineering. vol. 63, p. 105310. doi: 10.1016/J.CSITE.2024.105310.
- P. Martínez, M. Lucas, F. J. Aguilar, J. Ruiz, and P. V. Quiles. (2024). Experimental study of an on-grid hybrid solar air conditioner with evaporative pre-cooling of condenser inlet air. Applied Thermal Engineering, vol. 248, p. 123335. doi: 10.1016/J.APPLTHERMALENG.2024.123335.
- X. Chen, Y. Liang, L. Yin, and H. Cheng. (2024). Experimental study on heat recovery and utilization of air conditioning condensate. Energy Reports, vol. 12, pp. 4004–4015. doi: 10.1016/J.EGYR.2024.10.007.
- B. Bohara, B. Pandey, R. Pungaliya, S. C. Patwardhan, and R. Banerjee. (2023). Experimental Study of the Model Predictive Control for a Residential Split Air Conditioner. e-Prime - Advances in Electrical Engineering, Electronics and Energy, vol. 3, p. 100099. doi: 10.1016/J.PRIME.2022.100099.
- F. Fauzun et al. (2023). Numerical Study the Effect of Air Barriers Height Inside the Air Conditioning Ducting to Satisfy the Regulation of Indonesia Minister of Transportation Number 69 Of 2019. Journal of Applied Engineering Science, vol. 21, no. 4, pp. 1156–1170. doi: 10.5937/jaes0-45415.
- A. Abolore, D. Olurotimi, O. Edward, H. Olajumoke, and F. Nihinlola. (2024). Arduino microcontroller based real-time monitoring of haemodialysis process for patients with kidney disease. e-Prime - Advances in Electrical Engineering, Electronics and Energy, vol. 7, no. November 2023, p. 100403. doi: 10.1016/j.prime.2023.100403.
- M. Todd, A. J. E. Gallant, A. Wang, J. Plucinski, and V. N. L. Wong. (2025). Quantifying inter- and intra-sensor variability in low-cost soil moisture and soil temperature sensors: A comparative study. Smart Agricultural Technology, vol. 12, no. July, p. 101186. doi: 10.1016/j.atech.2025.101186.
- Y. Wang, Q. Sun, Z. Zhang, Y. Liu, and Z. Gao. (2025). Analysis of temperature and humidity fields in heated enclosure construction of bridge pile caps and optimal sensor placement. Case Studies in Thermal Engineering, vol. 72, no. March, p. 106324. doi: 10.1016/j.csite.2025.106324.
- A. Morchid et al. (2025). IoT-enabled smart agriculture for improving water management: A smart irrigation control using embedded systems and Server-Sent Events. Scientific African, vol. 27, no. June 2024, pp. 1–17. doi: 10.1016/j.sciaf.2024.e02527.
- P. S. Vulimiri, S. Riley, F. X. Dugast, and A. C. To. (2025). A mean–variance estimation bidirectional convolutional long short-term memory surrogate model predicting residual stress and model error for laser powder bed fusion. Addit Manuf, vol. 97, no. August 2024, p. 104591. doi: 10.1016/j.addma.2024.104591.
- H. Zhang, C. Fan, T. Xiong, G. Liu, and G. Yan. (2023). Improving performance of air conditioning system by using variable-circuit heat exchanger: Based on the Chinese APF standard. Case Studies in Thermal Engineering, vol. 50, no. August, p. 103422. doi: 10.1016/j.csite.2023.103422.
- I. G. A. Negara et al. (2025). Experimental Analysis of Thermodynamic Performance for 2 . 5 kW Split Inverter Air Conditioning Unit with R-410A. International Journal of Automotive and Mechanical Engineering, vol. 22, no. 2, pp. 12388–12403.
- P. Zi et al. (2023). Modeling method of variable frequency air conditioning load. Energy Reports, vol. 9, pp. 1011–1017. doi: 10.1016/j.egyr.2022.11.035.
- S. Liu, W. Ge, and X. Meng. (2024). Influence of the shading nets on indoor thermal environment and air-conditioning energy consumption in lightweight buildings. Energy Reports, vol. 11, no. April, pp. 4515–4521. doi: 10.1016/j.egyr.2024.04.032.
- J. Ham, Y. Shin, M. Lee, and H. Cho. (2023). Investigation of performance and energy cost of automobile air-conditioner using alternative refrigerants based on thermal comfort using various cooling seats. Results in Engineering, vol. 20, no. October, p. 101541. doi: 10.1016/j.rineng.2023.101541.
- A. Alblawi. (2025). A desiccant evaporative air conditioning performance improvement using heat pipe heat exchanger as a heat recovery device. Case Studies in Thermal Engineering, vol. 69, no. March, p. 106027. doi: 10.1016/j.csite.2025.106027.
Conflict of Interest Statement
The authors hereby declare that there are no conflicts of interest related to this research.
Author Contributions
Data Availability Statement
Data that support the findings of this research are available from the corresponding author upon a reasonable request.
Supplementary Materials
There are no supplementary materials associated to this research.