Volume 23 article 1308 pages: 735-741
Received: Jul 08, 2025 Accepted: Nov 21, 2025 Available Online: Dec 13, 2025 Published: Dec 15, 2025
DOI: 10.5937/jaes0-60022
PREDICTIVE MODELING OF TRACK QUALITY INDEX WITH NEURAL NETWORKS
Abstract
The Track Quality Index (TQI) was used as a primary metric to assess the structural and geometric condition of railway track infrastructure, which is directly related to traffic safety, ride comfort, and maintenance prioritization. This paper presents a predictive modeling approach aimed at forecasting future TQI values by incorporating historical measurements, geometric characteristics, and operational parameters. The analyzed dataset consisted of 821 observations of track sections collected over several measurement cycles. It included explanatory variables such as previous TQI levels, train operating speed, traffic volume, and infrastructure elements like tunnels, bridges, and records of ballast tamping. A General Regression Neural Network (GRNN) was trained using 657 data samples and validated on 164 samples, achieving a coefficient of determination (R²) of 0.699, a root mean square error (RMSE) of 4.70, and a mean absolute error (MAE) of 3.55. The results confirmed that neural networks are suitable for short-term predictions of track conditions, facilitating more effective planning and optimization of maintenance interventions. The proposed framework supports engineering decision-making related to condition-based maintenance of railways.
Highlights
- A neural network model was developed to predict the Track Quality Index (TQI) using historical geometric, operational, and maintenance data.
- General Regression Neural Network (GRNN) achieved the best predictive performance among all tested configurations (R² = 0.699).
- Most influential features for TQI prediction were past TQI values and ballast tamping frequency.
- GRNN demonstrated strong generalization ability despite limited training data and complex input structure.
- The proposed model supports condition-based railway maintenance and can be integrated into digital infrastructure management systems.
Keywords
Content
1 Introduction
The quality of railway track geometry plays a crucial role in ensuring the safe, efficient, and cost-effective operation of rail transport systems. Track irregularities contribute to increased dynamic forces, reduced ride comfort, higher maintenance needs, and a greater risk of infrastructure failure [1, 2]. To monitor and evaluate the condition of the track, the track quality index (TQI) is widely used as a comprehensive numerical indicator derived from measured geometric parameters [3]. This index reflects the overall state of the track section and is critical for prioritizing maintenance interventions and optimizing lifecycle costs [4, 5].
Previous studies have explored various statistical and machine learning methods for modeling track degradation and forecasting its progression. Traditional approaches, such as linear regression or threshold-based rules, often fail to capture the nonlinear interactions between influencing factors, including speed, traffic volume, substructure conditions, and maintenance history [6]. More recent works have demonstrated the potential of neural networks in predicting track-related indicators, benefiting from their ability to learn complex patterns from historical data [7, 8]. However, selecting an appropriate neural network architecture and evaluating its generalization performance remain essential steps for practical implementation [9].
The objective of the present study was to develop and evaluate a neural network model for forecasting the track quality index using historical data and infrastructure parameters. Multiple neural configurations were considered, and the most accurate model was selected based on performance comparison. The results provide insights into the applicability of data-driven methods for railway infrastructure monitoring and maintenance planning.
2 Materials and methods
2.1 Study area and dataset description
This study utilized data from the Kolasin–Podgorica section of the Vrbnica–Bar railway line in Montenegro. The selected section traverse’s complex mountainous terrain and incorporates numerous engineering structures such as tunnels, bridges, and sharp horizontal curves, which makes it particularly relevant for analyzing geometric track degradation phenomena.
Track Quality Index (TQI) measurements were obtained during four inspection campaigns conducted in 2017, 2019, 2022, and 2024. For predictive modeling purposes, only data from the first three campaigns (2017, 2019, and 2022) were used for model training and calibration, while the 2024 dataset was exclusively reserved for model validation.
To improve the spatial resolution and analytical precision, the entire railway section was divided into homogeneous segments of 20 meters in length. Within each segment, track geometry was assumed to be sufficiently uniform, ensuring consistency and granularity in the modeling dataset. The final dataset comprised 821 segment-level records per measurement year.
2.2 Track quality index calculation
The Track Quality Index (TQI) served as the dependent variable in the modeling framework, representing the overall geometric condition of the track. TQI was calculated using the Combined Standard Deviation (CoSD) method, which integrates the standard deviations of multiple track geometry parameters into a single, dimensionless index: [10, 11, 12]:
| $TQI = \sum_{j=1}^{M} w_j \,\sigma_j$ |
(1) |
where:
- σј is the standard deviation of each geometry parameter
- ωј is a weight factor based on EN 13848 and UIC 518 standards
This method enables the normalization and aggregation of parameters expressed in different units, aligning with European standards for objective condition assessment.
The specific track geometry parameters included in the TQI calculation are listed in Table 1, along with their abbreviations, measurement units, and descriptions.
Table 1. Geometric parameters used in TQI calculation.
| Parameter | Abbreviation | Unit | Description |
| Track gauge | TG | mm | Distance between inner rail heads, 14 mm below the top surface. |
| Cant | C | mm | Vertical difference in height between the two rails. |
| Twist | T | mm | Change in cant over a defined base length. |
| Alignment – left rail | AL | mm | Lateral deviation of the left rail from a 10 m reference chord. |
| Alignment – right rail | AR | mm | Lateral deviation of the right rail from a 10 m reference chord. |
| Longitudinal level – left rail | LLL | mm | Vertical deviation of the left rail from a reference longitudinal plane. |
| Longitudinal level – right rail | LLR | mm | Vertical deviation of the right rail from the same longitudinal reference plane. |
This method enables the normalization and aggregation of parameters with different units, providing an objective and standardized indicator of overall track geometry quality.
2.3 Input features
Each 20-meter track segment was characterized by a structured set of input features capturing geometric, infrastructural, operational, and maintenance-related aspects of the railway system. These features were categorized as follows:
- Track Quality Index (TQI)
- Infrastructure Parameters
- Tunnel presence (0/1): Binary indicator for whether the segment passes through a tunnel.
- Bridge presence (0/1): Indicates presence of a bridge structure on the segment.
- Station proximity (0/1): Marks whether the segment is near a station or turnout area.
- Curve radius (in meters): Horizontal curvature of the track; lower values indicate sharper curves.
- Longitudinal gradient (in ‰): Slope of the track in the longitudinal direction, expressed in per mile.
- Operational Parameters
- Speed: Maximum allowed speed in km/h.
- Traffic intensity: Total annual gross tons passing through the segment.
- Maintenance Data
- Tamping of track (0/1 per year): Indicates if the track was tamped in a given year.
- Tamping of ballast (0/1 per year): Records whether ballast consolidation was performed.
- Number of tamping interventions: Cumulative tamping actions between two TQI measurements.
All numerical variables were scaled using the MinMaxScaler algorithm to normalize the feature range and eliminate scale bias during model training.
2.4 Neural network modeling approach
To forecast future values of the Track Quality Index (TQI), a supervised machine learning methodology based on artificial neural networks was implemented. Neural networks are well-suited for modeling complex, nonlinear relationships among multiple input variables and the target output (TQI), and are widely used in predictive infrastructure modeling.The modeling was performed using the Neural Tools software platform, which supports neural network training and validation for regression problems. Two types of feedforward networks were considered:
- A General Regression Neural Network (GRNN)
- Four Multilayer Feedforward Networks (MLFN) with 2, 3, 4, and 5 hidden nodes.
2.4.1 General Regression Neural Network (GRNN)
GRNN is a radial basis network composed of four layers: input, pattern, summation, and output. It estimates the conditional mean of the output based on kernel regression principles and does not require iterative training, which enables very fast convergence. Advantages of GRNN include:
- High accuracy with limited data;
- Tolerance to noise;
- Automatic generalization.
In this study, the GRNN was trained on 657 records (80%) and validated on 164 records (20%). The smoothing factor was optimized internally.
2.4.2 Multilayer Feedforward Networks (MLFN)
MLFNs consist of an input layer, one hidden layer, and an output layer. Nonlinear activation functions (e.g., sigmoid, tanh) are applied in the hidden layer, while the output layer uses a linear function for regression.Training was conducted using the backpropagation algorithm with gradient descent optimization. Four configurations were tested with hidden layers containing 2 to 5 neurons. The networks were trained to minimize mean squared error (MSE), and early stopping was applied to prevent overfitting.
2.4.3 Model evaluation
All models were evaluated using the following performance metrics:
- R² (coefficient of determination): Proportion of variance in TQI explained by the mode
- RMSE (root mean square error): Average magnitude of prediction error
- MAE (mean absolute error): Mean absolute deviation from observed values.
- MSE (mean squared error): Penalizes larger prediction errors more severely.
These metrics provided insight into model accuracy, generalization capability, and practical usability in the context of track maintenance decision-making.
3 Results and discussion
This section presents the results of the neural network models trained and tested to forecast the Track Quality Index (TQI). Five models were evaluated, including one General Regression Neural Network (GRNN) and four Multilayer Feedforward Networks (MLFN) with varying numbers of hidden nodes.Table 2 provides a comparative overview of the model performance based on four key metrics: coefficient of determination (R²), root mean square error (RMSE), mean absolute error (MAE), and mean squared error (MSE). The GRNN model achieved the best overall performance with an R² of 0.699, RMSE of 4.70, MAE of 3.55, and MSE of 22.05, indicating a strong ability to generalize and accurately predict TQI values.
Table 2. Model performance comparison based on R², RMSE, MAE, and MSE
| Model | R2 | RMSE | MAE | MSE |
| GRNN | 0.699 | 4.70 | 3.55 | 22.05 |
| MLFN (2 Nodes) | 0.491 | 6.11 | 4.25 | 37.27 |
| MLFN (3 Nodes) | 0.479 | 6.18 | 4.39 | 38.13 |
| MLFN (4 Nodes) | 0.489 | 6.12 | 4.61 | 37.40 |
| MLFN (5 Nodes) | 0.425 | 6.49 | 4.94 | 42.08 |
All MLFN models showed inferior performance compared to the GRNN. The MLFN with two hidden nodes achieved slightly better results among the MLFNs but still fell short of the GRNN. Increasing the number of hidden nodes in MLFN models did not lead to significant improvement and, in some cases, resulted in a decline in accuracy, likely due to overfitting or increased model complexity without proportion-al benefit.
The results confirm that the GRNN model is best suited for this dataset and problem structure. Among all tested configurations, it offers the highest predictive accuracy and the most balanced error distribution.
Figure 1 illustrates the scatter plot comparing actual and predicted TQI values for the GRNN model. The points are closely clustered around the reference line (y = x), demonstrating high predictive accuracy. This visual confirmation supports the quantitative metrics shown in Table 1. Figure 2 presents the histogram of prediction errors, where the distribution is approximately symmetric and centered around zero, indicating that the model does not systematically overestimate or underestimate the target values.
 Fig. 1. Actual vs Predicted TQI – GRNN Model Scatter plot showing GRNN model predictions compared to actual values
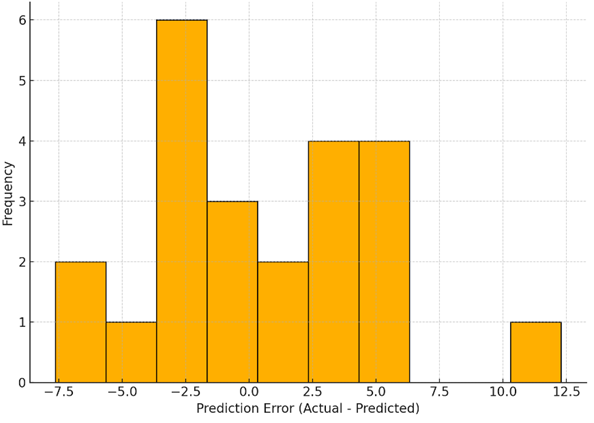
Fig. 2. Distribution of Prediction Errors – GRNN Model Histogram of prediction errors (Actual - Predicted) for GRNN model test data
From an engineering standpoint, the achieved RMSE of 4.70 mm and MAE of 3.55 mm indicate a high level of predictive precision in the context of track geometry assessment. Considering that typical intervention thresholds for individual geometric parameters—such as twist, alignment, or longitudinal level—range from 5 to 7 mm depending on the standard and location, the GRNN model's average error remains well below these limits. This suggests that the model is capable of forecasting future degradation within an acceptable tolerance range, which is critical for planning timely maintenance interventions and minimizing the risk of operational disruptions.
3.1 Limitations and practical implications
Although the GRNN model demonstrated strong predictive capability, its performance is closely tied to the quality and representativeness of the input data. Since the analysis focused on a single-track segment—Kolasin to Podgorica—its generalizability to other sections with different structural characteristics or operational demands may be limited. Additionally, environmental influences such as temperature variation, drainage effectiveness, and ground stability were not included in this study but could substantially impact long-term track performance. Despite these limitations, predictive modeling's practical potential in railway maintenance is considerable. Forecasted TQI values could support infrastructure managers in planning tamping operations more proactively and in evaluating the outcomes of previous maintenance work. Incorporating this approach into digital infrastructure management systems would allow for more dynamic risk assessment and better allocation of maintenance resources.
The results of this study indicate that the General Regression Neural Network (GRNN) significantly outperforms the tested Multilayer Feedforward Network (MLFN) configurations in predicting the Track Quality Index (TQI). This finding supports the hypothesis that non-linear, memory-based models such as GRNN are better suited for infrastructure condition forecasting, especially when input features are heterogeneous and their relationships with the output are non-trivial.The superior performance of the GRNN model, evidenced by a higher R² value and lower prediction errors, can be attributed to its ability to generalize from a relatively small training dataset without overfitting. While MLFN models required multiple iterations and hyper parameter tuning, the GRNN delivered stable results with minimal calibration. The MLFN architectures, despite variations in the number of hidden nodes, failed to achieve comparable accuracy—suggesting structural limitations in capturing the inherent variability of real-world railway infrastructure data.
These findings carry practical implications for railway asset management. Accurate TQI prediction enables more effective prioritization of track maintenance interventions, potentially reducing lifecycle costs and improving operational safety. By incorporating diverse features such as track geometry, structural conditions, operational load, and maintenance history, the GRNN-based approach provides a comprehensive and adaptable framework for predictive decision support.
To enhance interpretability of the GRNN model, Figure 3 presents the results of a variable sensitivity analysis, which quantifies the relative impact of each input on the predicted TQI values. The most influential predictors were previous TQI measurements (TQI_2022 and TQI_2019), followed by the number of tamping interventions conducted between measurement periods. Structural features such as bridge presence and station proximity also showed measurable influence, while operational speed and obstruction-related activities had moderate contribution.
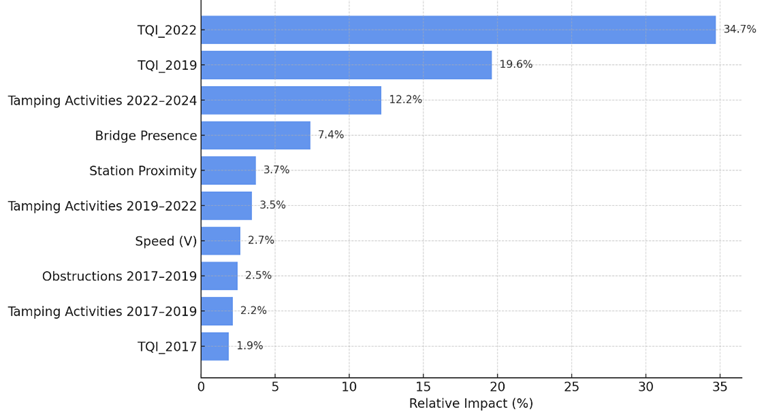
Fig. 3. Top 10 most influential input variables affecting TQI prediction according to GRNN sensitivity analysis
The negligible impact of total traffic load and curve radius may be attributed to their limited variability across the analyzed section. In contrast, temporal indicators of geometric degradation (TQI_2022, TQI_2019) demonstrated strong predictive power, reinforcing the notion that recent condition history is a critical factor for forecasting future performance. This suggests that, in practice, historical degradation trends and targeted maintenance records offer more explanatory strength than steady operational parameters.
Future work may explore the inclusion of environmental and geotechnical variables—such as temperature extremes, subgrade moisture, and drainage effectiveness—which were not available for this study but could further improve predictive precision. Moreover, extending the dataset across multiple track sections and longer monitoring intervals would facilitate the development of more generalizable and transferable models.
4 Conclusions
This study demonstrated that the General Regression Neural Network (GRNN) provides the most accurate and robust framework for forecasting the Track Quality Index (TQI) based on historical measurements and a comprehensive set of explanatory features. Among all evaluated models, the GRNN consistently outperformed the Multilayer Feedforward Network (MLFN) configurations across all performance metrics, including the coefficient of determination (R²), root mean square error (RMSE), mean absolute error (MAE), and mean squared error (MSE).
The GRNN model exhibited a strong ability to generalize from limited training data, effectively capturing complex nonlinear relationships among geometric indicators, structural features, operational loads, and maintenance records. Its stability, low calibration requirements, and superior predictive accuracy underscore its suitability for real-world applications in railway infrastructure management.
The proposed approach enhances the understanding of temporal track degradation and provides actionable insights for prioritizing maintenance interventions. By integrating the GRNN model into predictive infrastructure management systems, railway operators can improve risk assessment and resource allocation strategies.
Future research should focus on incorporating environmental and geotechnical variables (e.g., temperature, subgrade conditions), increasing the temporal coverage of measurements, and extending the modeling framework to multiple track sections. These enhancements would support the development of more generalizable and transferable models, applicable to a broader range of operational contexts.
The authors are grateful to the Railway Infrastructure Company of Montenegro (ŽICG) for providing access to the measurement data used in this study.
Acknowledgements
No external funding was received.
References
- Han, Z., Han, L., Chen, C., Han, Q., Jing, G., Cheng, Z. (2024). Dynamic calibration method for track geometry measurement system: A case study in China. Measurement Science and Technology, vol. 35, no. 6, p. 066007, DOI: 10.1088/1361-6501/ad2cd8
- Kite, D., Siino, G., Audley, M. (2020). Detecting embankment instability using measurable track geometry data. Infrastructures, vol. 5, no. 3, p. 29, DOI: 10.3390/infrastructures5030029
- Yan, T., Corman, F. (2020). Assessing and extending track quality index for novel measurement techniques in railway systems. Transportation Research Record: Journal of the Transportation Research Board, vol. 2674, no. 8, pp. 24–36, DOI: 10.1177/0361198120923661
- Amin, R., Kumar, A., Hassan, S. (2023). Predictive maintenance in rail transport: Evaluating the efficacy of the track quality index. Transport Reviews, vol. 43, no. 2, pp. 256–274.
- Tsai, C. C., Lin, W. Y., Chao, J. C. (2020). Maintenance strategies for railway infrastructure: Integrating track quality indices in cost optimization. Rail Engineering and Maintenance, vol. 45, no. 2, pp. 203–219.
- Li, X., Zhang, Y., Chen, H. (2016). Modeling track degradation in railway systems: Limitations of linear regression and the promise of nonlinear approaches. Journal of Rail Transportation Engineering, vol. 12, no. 3, pp. 145–159.
- Branford, Q., Ellis, P., Martin, D. (2022). Evaluation of neural network architectures for predicting track condition deterioration. Journal of Infrastructure Systems, vol. 28, no. 1, p. 04022009.
- Zhao, Q., Li, B., Hu, F. (2018). Integrating physical models and neural networks for enhanced track degradation forecasting. Structural Safety, vol. 66, pp. 73–81.
- Zhang, Y., et al. (2020). A survey on neural networks in time series forecasting: Comprehensive framework, state of the art and future directions. Neural Networks, DOI: 10.1016/j.neunet.2019.02.013
- European Committee for Standardization (CEN) (2019). EN 13848-1: Railway applications – Track geometry quality – Part 1: Characterization of track geometry. Brussels, Belgium. Available: https://standards.iteh.ai/catalog/standards/cen/19848cc1-08a5-44aa-96aa-18294c6ab12f/en-13848-1-2019
- European Committee for Standardization (CEN) (2020). EN 13848-2: Railway applications – Track geometry quality – Part 2: Measuring systems – Track recording vehicles. Brussels, Belgium. Available: https://knowledge.bsigroup.com/products/railway-applications-track-track-geometry-quality-measuring-systems-track-recording-vehicles-1/standard
- International Union of Railways (UIC) (2009). UIC 518: Testing and approval of railway vehicles from the point of view of their dynamic behaviour – Safety – Track fatigue – Running behaviour. UIC Code 518. Available: https://www.normadoc.com/spanish/uic-518-2009-10-4542750.html
Conflict of Interest Statement
The authors declare no conflict of interest.
Author Contributions
Data Availability Statement
The datasets generated and/or analyzed during the current study are not publicly available due to institutional restrictions (ŽICG, IŽS, and others), but are available from the corresponding author upon reasonable request.
Supplementary Materials
No supplementary materials are associated with this manuscript.