Volume 23 article 1302 pages: 664-674
Received: Apr 02, 2025 Accepted: Nov 10, 2025 Available Online: Dec 07, 2025 Published: Dec 15, 2025
DOI: 10.5937/jaes0-57953
REGRESSION ANALYSIS ALGORITHM FOR THE RESULTS OF REINFORCED CONCRETE SLABS TECHNICAL INSPECTION
Abstract
The paper presents an algorithm for calculating key statistical parameters, including correlation dependences, correlation coefficients, and a method of checking the presence of a linear dependence. A quadratic regression equation is obtained, regression curve graphs are constructed, distribution functions and probability densities with the procedure for their normalization are calculated. The main statistical parameters of random variables are also calculated: mathematical expectation, variance, standard deviation, and quantiles of various levels. The proposed regression analysis algorithm can be used to assess safety and reliability of building structures, which allows analyzing their operation in a probabilistic form. Based on the theoretical and applied results of the work, prospects are opened for further development of probabilistic analysis methods for safety of construction projects as a whole, taking into account their complex structure and interaction of various structural elements.
Highlights
- Quadratic regression model links concrete strength to technical state categories in a sample of roof slabs.
- Normalized probability density function derived for reliability assessment of reinforced concrete elements.
- Algorithm enables probabilistic safety analysis from non-destructive testing data.
Keywords
Content
1 Introduction
When designing and operating various structural elements, it is important to assess their reliability (safety) based on analyzing the parameters of the bearing capacity (strength, rigidity, stability).
Recently, along with deterministic methods of studying structures, probabilistic methods have also become essential that allow determining not only the probabilities of failure of individual structural elements but also to identify their service life (resource forecasting), as well as their maintainability and optimal terms required by their actual technical condition.
For these purposes, systematic (with the possibility of monitoring) maintenance should be carried out at various stages of operation.
The result of the survey is a large set of statistical data on the parameters of strength, rigidity and stability measured by technical means, which requires deep engineering analysis with the possibility of analytical processing of the obtained data. Namely, it is necessary to apply the methods of probability theory and mathematical statistics, which provide sufficiently accurate and scientifically substantiated results of engineering studies.
The regression analysis algorithm proposed in this paper is logically "tied" to the conditions of statistical processing of the technical condition parameters of some building structures.
The set of values of the studied parameters of the structure technical condition has the character of a randomly variable set of numbers (values), the so-called statistical "sample". In this case, the results of regression analysis allow obtaining experimental expressions of the distribution functions of random variables (parameters), on the basis of which the known characteristics of random variables (mathematical expectation, dispersion, variations, etc.) are calculated, and this in turn will allow determining=0- the required reliability parameters on a probabilistic basis (the probability of failure-free operation - "PFO", service life, etc.).
Inspection of structures, as well as prediction of their performance, are carried out constantly. For example, in work [1] to model the operational characteristics of a building due to the effect of the window opening mode, the Gaussian distribution was used. The study parameters are the internal and external air temperature; the comparative analysis of the results of logistic regression with the Gaussian model was performed, and it was found that the Gaussian distribution increased the accuracy of forecasting (up to 9.5%).
Article [2] studies the correlation issues between a set of global structural parameters and damage to parts of a building during earthquakes. The analysis of the given regression models showed that the level of damage to buildings as a result of earthquakes correlated well with the type of soil foundation.
Based on the relevant studies, it was established [3] that the external environment had the greatest impact on labor safety, while the structure of the model analysis was also shown for the importance, for the methods of production management and the level of its organization.
Based on the system of automated crack detection and prediction of crack depth, the authors of work [4] established optimal methods of repairing concrete structures. For this purpose, a binary model of the neutral network was developed, as well as integrated regression models. The model was tested when studying reinforced concrete slabs, and it showed ultra-high accuracy, reliability and automation level; the results obtained can be useful in assessing the technical condition of concrete structures and selecting optimal methods of their repair. A regression-based algorithm tested in the laboratory ensures reliable operation under various scenarios of bridge damage, using deep learning in the research [5], high accuracy in detecting cracks in concrete is achieved and the crack orientation correlates with their severity, which improves automated maintenance strategies. In the context of rigid pavements, an empirical regression model was developed to predict crack width based on concrete quality and subgrade CBR, providing a practical tool for assessing pavement durability and planning maintenance [6].
Article [7] analyzes the effect of statistical data on the results of regression of statistical (random) variables by introducing the concept of "fuzzy random variables"; using the values of expectation and variation of fuzzy random variables, σ-confidence intervals are constructed when inputting and outputting random variables. As a result of the proposed regression model, the problem is reduced to a nonlinear programming procedure.
In [8], it is proposed to develop correlation models of weathering limestone walls based on the "Rebound hammer" method. Based on the results of laboratory testing the samples, the regression analysis was performed between the "RH" value and the elastic modulus of the material. As a result, the presented correlation models have high determination coefficients.
In the process of monitoring the technical condition of structures, the authors of [9] show that difficulties arise in generalizing the data obtained in structures due to a significant discrepancy between the probability distributions of random variables reflecting the level of damage to objects. In this case, it is proposed to use relevant information based on the analysis of transfer components and a combination with the Gauss regression model, which allows for a quantitative assessment of the degree of damage to structures.
Article [10] proposes a more accurate (compared to the classical) method of nonlinear dynamic analysis of seismic data obtained in the experiment based on the mechanized regression analysis. As a result of using this method, a higher level of design of concrete structures is achieved, and the method itself demonstrates an excellent ability to take into account the dissipation of seismic energy.
The authors of [11] propose to use regression dependences of Gaussian processes, which allow determining attributes of a class of buildings with seismic sensitivity parameters. GP-regression is developed on the basis of such parameters of seismic randomness as medians and dispersions. The proposed model has a high degree of prediction of seismic impacts consequences.
In work [12] the results of a comprehensive statistical study of coefficients of inelastic displacements for designing buildings standing on shallow soils are analyzed and summarized; the building is considered as a dynamic system with one degree of freedom under corresponding seismic impacts (San Francisco). In this case, the effect of the period of oscillations of structures on the period of oscillatory motion of soft soil, the level of inelastic deformation, the magnitude of the earthquake and the distance to the epicenter are analyzed. The results of the study are average coefficients of bearing displacements and their dispersions, a simplified equation for determining the average coefficients of inelastic displacement based on the nonlinear regression analysis is derived.
Studying changes in the displacement of concrete structures depending on the temperature and relative humidity based on regression analysis of the rate of deformation of structures, with an additional analysis taking into account the increase in the volume of material of structures during long-term operation (in the time coordinate) is presented by the authors [13].
Article [14, 15] studies the effect of uncertainties (randomness of factors) in assessing the seismic risk of reinforced concrete buildings. Based on machine learning algorithms, software was developed in the Python language using advanced methods of optimizing an array of parameters (random search, etc.) to obtain the resulting seismic sensitivity curve for assessing seismic risk. The proposed ML method significantly reduces the number of computational operations. As examples illustrating the proposed methodology, 165 frames made of metal structures were considered (calculation points for the data array made 1121184 units).
Various types of regressors used in this case showed high performance, high accuracy, good correlation with the corresponding real dependence curves. The proposed graphical user interface has proven to be a reliable and practical tool for assessing the seismic risk of reinforced concrete buildings.
Paper [16] deals with the probabilistic assessment of the safety of structures under extreme loads capable of causing local damage or even progressive collapse. The authors propose new models of progressive collapse sensitivity based on analyzing force effects of low-rise reinforced concrete frames. Random realizations of 2D and 3D structures were simulated by the Monte Carlo method using finite element methods. The brittle failure models were compared with models obtained using incremental dynamic analysis (IDA) to assess the inaccuracy of the proposed model of force pressure (punching). Corresponding regression models were developed for rapid assessment of the dynamic coefficient from a given level of displacement (punching settlement).
The methodology of deriving regression equations for predicting maximum inelastic displacements and accelerations of the masses of steel frame structures with a concentrically braced frame (CBF) is shown by the authors of [17]. For a set of 24 CBF studies, a database was formed based on a large number of nonlinear regression analyses of the time history of seismic effects. Multivariate regression models for peak (maximum) displacements and accelerations were reduced to the data of the results of nonlinear time history analysis (NLTHA). The presented regressions are close to the NLTHA results in a wide range of initial data. The advantage of the authors’ models is the absence of the need for nonlinear analyses.
Thus, the regression analysis algorithm proposed by the authors of this article allows estimating reliability (or safety) of the objects under study in the probabilistic form based on the results of a technical inspection of buildings and structures. In the future, it is necessary to apply this algorithm to buildings and structures as a whole, moving from regression analysis of individual structural elements to the methodology of complex regression analysis of the structure under study.
2 Materials and methods
Let’s show the content of the regression analysis algorithm only for a separate type of building structures, reinforced concrete roof slabs. Let’s take as a study a statistical sample of structural elements in the amount of 818 roof slabs. Based on the results of the technical condition, the following data on the parameters of the concrete strength of the structures were obtained (Figure 1). $R_c$ (further denoted as $x$ ) within the limits:
![]()
МPа МPа (with a step of 10 МPа).

Fig. 1. Conducting non-destructive testing of slabs
Based on instrumental measurements and visual inspection criteria at [18], the technical condition of the roof slabs was assessed according to three main categories [19]:
$y_1$ is a workable structure;
$y_2$ is a limited functionality structure;
$y_3$ is an ultimate limit state structure.
3 Results and discussion
The data for x1; y1 are given in Table 1 as a two-dimensional system of discrete random variables.
Table 1. Two-dimensional statistical sample
|
|
(1 state) |
(2 state) |
(3 state) |
|
|
|
- |
- |
4 |
4 |
|
|
- |
118 |
2 |
120 |
|
|
403 |
9 |
- |
412 |
|
|
282 |
- |
- |
282 |
|
|
685 |
127 |
6 |
818 |
![]() is the statistical sample for the regression analysis;
is the statistical sample for the regression analysis;
![]() is the number of slabs (shown in the field of Table 1);
is the number of slabs (shown in the field of Table 1);
![]() is the structure concrete strength, МPа;
is the structure concrete strength, МPа;
![]() is the category of technical state associated with the
is the category of technical state associated with the ![]() value.
value.
The outline of the histogram in Figure 2 shows that the nature of the change in the factors under study quite acceptably approaches the known normal law of probability density distribution.
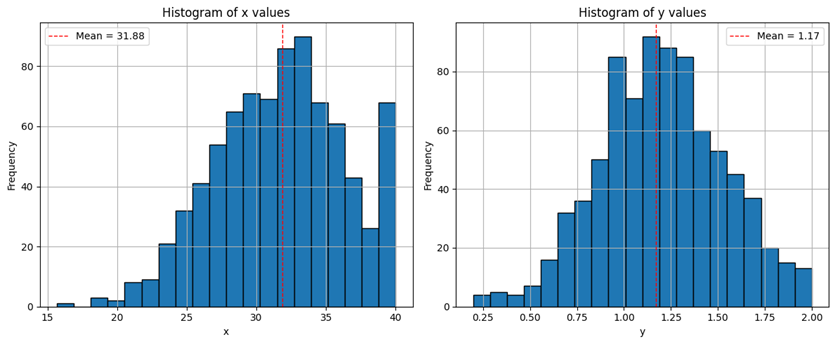
Fig. 2. Distribution of the sample by x and y
The purpose of the work is to establish a statistical relationship between the values xi and yi that based on regression analysis. Next, perform statistical processing of the data in Table 1.
Divide the data in Table 1 into two separate tables: for the parameters (Table 3) or Figure 2.
Table 2. One-dimensional statistical sample with x-axis
|
|
|
|
|
|
10 |
4 |
40 |
400 |
|
20 |
120 |
2400 |
48000 |
|
30 |
412 |
12360 |
370800 |
|
40 |
282 |
11280 |
451200 |
|
|
818=N |
26080 |
870400 |
Table 3. One-dimensional statistical sample with y-axis
|
|
|
|
|
|
1 |
685 |
685 |
685 |
|
2 |
127 |
254 |
508 |
|
3 |
6 |
18 |
54 |
|
|
818=N |
957 |
1247 |
Calculate the parameters of the sample using the data in Table 2:
- Average statistical value:
![]()
![]()
- Dispersion (value scatter criterion):
![]()
- Standard deviation:
![]()
Based on Table 3:
| (a) | |
| (b) | |
| (c) |
Calculate the complex product of $n\cdot x\cdot y$ values (Table 4) taking into account the data from Table 1.
Table 4. Two-dimensional statistical sample
|
|
1 |
2 |
3 |
|
|
10 |
0 |
0 |
120 |
120 |
|
20 |
0 |
4720 |
120 |
4840 |
|
30 |
12090 |
540 |
- |
12630 |
|
40 |
11280 |
0 |
- |
11280 |
|
|
23370 |
5260 |
240 |
28870 |
based on Table 4:
|
|
(1) |
Using the data from Tables 1-4 and the average statistical values and parameters obtained from them, perform the following general calculation tasks:
Calculate the correlation relationship between $\eta_{xy}$ values for x and y , which determines the degree of their connection with each other.
|
|
(2) |
where $\sigma_x,\sigma_y$ are the standard deviation (SD) of the x and y parameters, respectively;
$\sigma_x,\sigma_y$ are bond correlation coefficients.
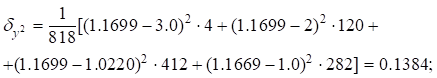
Based on (1) calculate (for example, through the $\delta_y$ value)
- the $y(xi)$ value based on Table 1 data:
|
|
(3) |

- the $\delta_y$ value:
|
|
(4) |
Based on (4), with $y=1.1699$ (taking into account values (3)), there is:
|
|
(5) |
Based in (2) (or $\sigma_y=0.3946)$), taking into account (5), there is:
![]()
Conclusion: the relationship between the x and y parameters is strong since the nxy value is very close to 1.
Calculate the correlation coefficient rxy:
|
|
(6) |
|
|
(7) |
Value (7) confirms the idea that in this case the dependence between the x and y values is strong because ![]() .
.
Testing hypotheses of the degree of dependence (linear or nonlinear) between the x and y values.
(1) Put forward a hypothesis of the presence of a linear dependence.
- Calculate the Tobs value:
|
|
(8) |

- Determine the value of the student criterion at [20] (or $\alpha=0.01; N\rightarrow\infty$):
|
|
(9) |
- Compare values (8, 9):
![]() .
.
This means that the hypothesis of a linear relationship between the x and y values is not confirmed.
(2) Assume that the relationship between x and y is nonlinear (in particular, quadratic):
|
|
(10) |
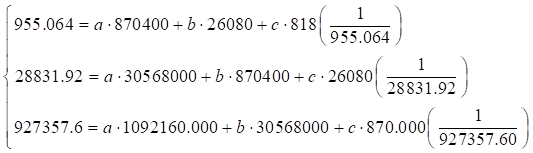
- Determine coefficients (a,b,c) in equation (10):
|
|
(11) |
|
|
(12) |
|
|
(13) |
To solve equations (11, 12, 13), compile a table of calculations.
Table 5. A table of calculations
|
|
|
|
|
|
|
|
|
|
|
|
10 |
3.0 |
4 |
40 |
400 |
4000 |
40000 |
12 |
120 |
1200 |
|
20 |
2.0 |
120 |
2400 |
48000 |
960000 |
19200000 |
240 |
4800 |
96000 |
|
30 |
1.022 |
412 |
12360 |
370800 |
11124000 |
333720000 |
421.064 |
12631.92 |
378957.60 |
|
40 |
1.0 |
282 |
11280 |
451200 |
18480000 |
739200000 |
282 |
11280 |
451200 |
|
|
- |
818 |
26080 |
870400 |
30568000 |
1092160000 |
955.064 |
28831.92 |
927357.60 |
or
|
|
(14) |

Solving the system of linear algebraic equations (14), there is obtained:
|
|
(15) |
Substitute values (15) into expression (10):
|
|
(16) |
|
|
|
Represent equation (16) graphically (Figure 3):

Fig. 3. Graph of the regression curve
Probability distribution function:
|
|
(17) |
|
|
(18) |
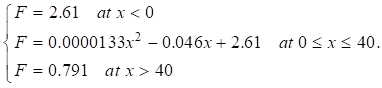
$f(x)=a(0.0000266x-0.046)$ is the given probability density from (18).
Determine the value from the normalization condition:
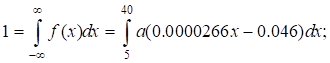
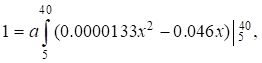
It follows that:
![]()
![]()
Then, instead of (18), there is the final probability density function:
|
|
(19) |
is normalized probability density function in comparison with (18).
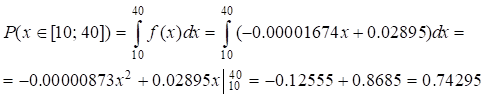
- Calculate the probability P(x) for x in the range [10, 40] using equation (19), and plot the probability density function (PDF) shown in Figure 4: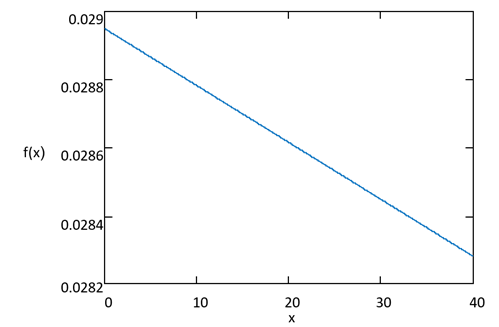
Fig. 4. Probability density function
|
|
(20) |
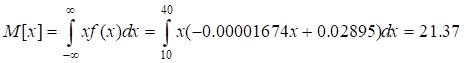
- Calculate the mathematical expectation :
|
|
(21) |
|
|
(22) |
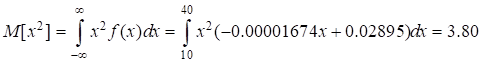
- Calculate dispersion:
|
|
(23) |
- Calculate the level quantile $\alpha=0.75$:
|
|
(24) |

To the left of the level, the probability is 0.5723 or 57.23%.
Based on the work [3], we construct confidence intervals (boundaries) for the parameters of the normal law of probability density distribution:
1st confidence interval
| (25) |
$x$ is the sample mean;
a is the parameter under study;
$\sigma$ is the standard deviation;
n is the number of experiments (tests);
$\gamma$ is the level of trust;
$\tau_{1+\gamma/2}$ - is the quantile of the standard normal distribution. The probability P that the parameter under study a falls into the area $\gamma$.
| (26) |
In our study, it is given:
a = x - is the strength of concrete structure;
$\gamma$ = 0,9 - is the specified level of trust;
$\sigma=\sqrt{D_x}=\sqrt{17.57}=4.192$ - is the standard deviation is calculated from (23);
$x$ = 21,37 by (21).
According to this data:
- further calculated the quantile of the normal distribution [3]:
![]()
![]()
- according to formula (25):
| (27) |
- according to the formula (26):
| (28) |
The probability of finding the concrete strength of reinforced concrete pavement slab structures according to the conditional sample data (Table 4) is in the confidence interval (27) with a probability of 90%.
4 Conclusions
In this paper, a research adaptation of the methods of regression analysis of statistical random variables obtained during the technical inspection of various objects in the form of buildings and structures was carried out.
There was developed an algorithm to identify the regression dependence between the statistical sample of technical ratio levels (serviceability categories) of reinforced concrete roof slabs and the results of their testing by a non-destructive testing method (with determination of the compressive strength of concrete).
The statistical data of the above tests are presented in the form of a two-dimensional table of random variables x, y (Table 1) with the total sample of 818 slabs.
Based on the known principles of regression analysis, an algorithm for calculating the necessary statistical parameters is shown, including correlation dependences of the values, correlation coefficients. A method of checking the presence of a linear dependence is given, an equation of a nonlinear (quadratic) dependence between the x and y values is obtained, a method of constructing a regression curve graph is shown (Figure 3), the distribution functions and probability densities are calculated with the procedure for their normalization.
The known statistical parameters of continuously distributed random variables are calculated: probabilities of R variables, mathematical expectation, dispersion, standard deviation, quantiles of different levels.
The proposed regression analysis algorithm tied to the problems of safety (reliability) of structural elements, will allow analyzing the operation of construction objects in a probabilistic (non-deterministic) form.
Based on the theoretical provisions and applied results presented in this work, in the future, it becomes possible to extend (to develop) them to the probabilistic analysis of the safe operation of construction objects as a whole, as a complex set of different types of structures that determine their space-planning and design solution.
Acknowledgements
No external funding was received.
References
- Pan, S., Han, Y., Wei, S., Wei, Y., Xia, L., Xie, L. (2019). A model based on Gauss Distribution for predicting window behavior in building. Building and Environment, 149, 210–219. https://doi.org/10.1016/j.buildenv.2018.12.008
- Jünemann, R., de la Llera, J. C., Hube, M. A., Cifuentes, L. A., & Kausel, E. (2015). A statistical analysis of reinforced concrete wall buildings damaged during the 2010, Chile earthquake. Engineering Structures, 82, 168–185. https://doi.org/10.1016/j.engstruct.2014.10.014
- Liu, R., Cheng, W., Yu, Y., Xu, Q., Jiang, A., & Lv, T. (2019). An impacting factors analysis of miners’ unsafe acts based on HFACS-CM and SEM. Process Safety and Environmental Protection, 122, 221–231. https://doi.org/10.1016/j.psep.2018.12.007
- Laxman, K. C., Tabassum, N., Ai, L., Cole, C., & Ziehl, P. (2023). Automated crack detection and crack depth prediction for reinforced concrete structures using deep learning. Construction and Building Materials, 370. https://doi.org/10.1016/j.conbuildmat.2023.130709
- Fan, C.-L. (2025). Concrete crack detection and severity assessment using deep learning and multispectral imagery analysis. Measurement: Journal of the International Measurement Confederation, 247. https://doi.org/10.1016/j.measurement.2025.116825
- Soehardjono, A., Wisnumurti, N., Nuralinah, D., & Simatupang, R. M. (2025). The effect of concrete quality and subgrade CBR on crack width in rigid pavement: An empirical model approach. Journal of Applied Engineering Science, 23(1), 180–190. https://doi.org/10.5937/jaes0-56497
- Watada, J., Wang, S., & Pedrycz, W. (2009). Building confidence-interval-based fuzzy random regression models. IEEE Transactions on Fuzzy Systems, 17(6), 1273–1283. https://doi.org/10.1109/TFUZZ.2009.2028331
- Eljufout, T., Hadadin, N., Haddad, A., & Alhomaidat, F. (2023). Correlation models for utilising rebound hammer technique in evaluating weathered limestone walls. Australian Journal of Structural Engineering, 24(1), 77–87. https://doi.org/10.1080/13287982.2022.2087845
- Omori Yano, M., da Silva, S., Figueiredo, E., & Giacon Villani, L. G. (2023). Damage quantification using transfer component analysis combined with Gaussian process regression. Structural Health Monitoring, 22(2), 1290–1307. https://doi.org/10.1177/14759217221094500
- Xu, G., Guo, T., & Li, A. (2022). Equivalent linearization method for seismic analysis and design of self-centering structures. Engineering Structures, 271. https://doi.org/10.1016/j.engstruct.2022.114900
- Gentile, R., & Galasso, C. (2020). Gaussian process regression for seismic fragility assessment of building portfolios. Structural Safety, 87. https://doi.org/10.1016/j.strusafe.2020.101980
- Ruiz-García, J., & Miranda, E. (2004). Inelastic displacement ratios for design of structures on soft soils sites. Journal of Structural Engineering, 130(12), 2051–2061. https://doi.org/10.1061/(ASCE)0733-9445(2004)130:12(2051)
- Uda, Y., Moriyama, A., Nakayama, A., Matsui, M., & Teramoto, A. (2024). LONG-TERM MONITORING OF STRUCTURES FOR CALCULATION OF EXPANSION BY ALKALI-SILICA REACTION. AIJ Journal of Technology and Design, 30(74), 5–10. https://doi.org/10.3130/aijt.30.5
- Kazemi, F., Asgarkhani, N., & Jankowski, R. (2023). Machine learning-based seismic fragility and seismic vulnerability assessment of reinforced concrete structures. Soil Dynamics and Earthquake Engineering, 166. https://doi.org/10.1016/j.soildyn.2023.107761
- Gao, J., Wei, S., & Huang, Y. (2025). Multitask Sparse Bayesian Machine Learning with Applications in Modeling of Seismic Attenuation and Clay Parameters with Small Data Sets. Journal of Computing in Civil Engineering, 40(1). https://doi.org/10.1061/JCCEE5.CPENG-6822
- Brunesi, E., & Parisi, F. (2017). Progressive collapse fragility models of European reinforced concrete framed buildings based on pushdown analysis. Engineering Structures, 152, 579–596. https://doi.org/10.1016/j.engstruct.2017.09.043
- Hickey, J., & Broderick, B. (2022). Regression models for predicting the inelastic seismic response of steel braced frames. Journal of Constructional Steel Research, 194. https://doi.org/10.1016/j.jcsr.2022.107338
- Dobromyslov, A. N. (2004). Otsenka nadezhnosti zdaniy i sooruzheniy po vneshnim priznakam. Moscow: АСВ. Retrieved from https://elibrary.ru/item.asp?id=19625448
- SN RK 1.04-26-2022. Reconstruction, capital and current repairs of civil and industrial buildings and structures (2022). Retrieved from https://online.zakon.kz/Document/?doc_id=35477963
- Augusti, G., Baratta, A., & Casciati, F. (1984). Probabilistic Methods in Structural Engineering. CRC Press
Conflict of Interest Statement
The authors declare no conflict of interest.
Author Contributions
Data Availability Statement
The data supporting the findings of this study are available from the corresponding author upon reasonable request.
Supplementary Materials
There are no supplementary materials to include.