Original Scientific Paper, Volume 23, Number 2, Year 2025, No 1277, pp 330-344
Received: Jan 19, 2025 Accepted: Apr 20, 2025 Published: Jun 16, 2025
DOI: 10.5937/jaes0-56142
RESEARCH OF CRITICAL CAUSES OF SOLAR PANEL AGING BASED ON FUZZY FAULT TREE AND PARETO CHART APPROACH
Abstract
The photovoltaic (PV) panel represents one of the most widely used means in the renewable energy power generation. In recent years, a comprehensive identification of all degradation modes of the PV panel and their causes, as well as its possible consequences are becoming more and more important to evaluate its reliability and performances in long-term. Using a fuzzy logic framework and Fault Tree Analysis (FTA), this paper conducts a qualitative and quantities evaluation of PV panel aging related to operating constraints. In this context, an understanding of the several ways that PV panel deteriorates and their mutual relations is carried out. Then, the relationships between the different PV panel aging modes and their causes are presented in the form of an easy-to-understand scheme using FTA. Fuzzy logic is used in conjunction with this FTA to quantify the likelihood of the PV panel degradation may occur. To conclude this reliability analysis, a Pareto chart is created to identify critical causes and provide some corrective measures. The results indicated that implementing of fuzzy FTA and Pareto chart, can ensure a thorough and accurate evaluation of the PV panel aging associated with operational limitations. Additionally, recommending corrective measures for the critical causes can reduce the occurrence probability of PV panel degradation.
Highlights
- Reviewing the various PV panel degradation mechanisms and their causes.
- Presented PV aging modes and causes through fault tree.
- Integrated fuzzy logic with FTA to estimate likelihoods of panel degradation events.
- Used Pareto chart to highlight critical causes and propose corrective actions.
Keywords
Content
1 Introduction
In recent years, the energy crisis and environmental issues are the world's major problems. Therefore, sustainable and renewable energy sources have been considered as alternative energy sources. In remote rural areas, PV panels are the most preferred renewable energy sources for provide energy. Even though PV technology has advanced, questions about its reliability have seen an increased interest in the recent years. The PV panel exhibit various defects may relate to manufacturing defect, fault handling during delivery and setup, high thermo mechanical strains, severe climatic and operating conditions. Various aging mechanisms, including discoloration of the encapsulant, delamination, corrosion, hot spots and snail track, might result from these factors. These degradation modes reduce the PV panel performance and lead to safety risks on the overall PV system. In order to analyze the reliability of PV panels, several previous research investigations have been conducted. Dirk C. Jordan et al [1] presented the various degradation modes of photovoltaic module. A. Jawad et al [2] reviewed the frequent issues with PV modules and proposed an approach to assess their health by identifying its parameters on the I-V curve such as open circuit voltage, photo-generated current, series resistance, and the shunt resistance, then contrasting them with the new PV module’s reference settings. A. Colli [3] presented and discussed the complete results of a Failure Modes and Effects Analysis (FMEA) of a grid connected PV system. Despite the significant advances in research focused on assessing the reliability of PV panels, there remains a notable gap in understanding the various degradation modes and their potential causes that PV. While significant efforts have been made to improve the efficiency and longevity of solar energy systems, comprehensive understanding of the many factors that contribute to PV panel degradation is still elusive. The intricate interplay of environmental conditions, manufacturing processes, and material science poses challenges in identifying precise causes and consequences. More focused research is necessary to fully understand the complexities of degradation mechanisms, enabling the development of preventive measures and innovative technologies that can effectively delays the occurrence of the diverse modes of PV panel degradation. In this context, the present work aims to contribute to the literature by developing a novel methodology that integrates FTA, Fuzzy logic and Pareto Chart to analyze and prioritize degradation modes of PV panels under uncertainty. The originality of this work lies in combining these three approaches into a unified framework tailored to photovoltaic systems. This integration allows for both a qualitative and quantitative evaluation of degradation causes and supports the recommendation of appropriate corrective and preventive actions. The incorporation of FTA into PV panel reliability research could offer a powerful methodology for understanding degradation modes, and identifying the potential causes. FTA is a well-known method for evaluation safety and reliability. It uses a methodical and systematic technique to calculate the probability of a Top Event (TE) resulting from sequences of Intermediate Events (IEs) and Basic Events (BEs). In order to determine the like hood of a TE, traditional FTA techniques mostly depend on accurate failure probability estimation of BEs. However, obtaining accurate failure data is challenging in the context of PV panel. The limitation raises from various factors, including insufficient documentation, a lack of statistical records, the inherent ambiguity in the behavior of BEs and the varied and unpredictable operating conditions of PV panels. These challenges highlight the need for alternative strategies that can handle uncertainty and incomplete data, especially in the analysis of complex systems like PV panels, where degradation mechanisms are influenced by environmental and operation variability. Expert judgment is included into Fuzzy Fault Tree Analysis (FFTA) to estimate the Failure Probability (FP) of the TE [4-7]. Experts are frequently given weights based on occupation, age, and degree of experience in order to minimize the inaccuracy brought on by subjective judgment [8, 9]. A wide range of industries have used the FFTA, including engineering construction, process industry, chemical process industries and nuclear safety [10-11]. However, the application of such an integrated FFTA and Pareto based framework has not yet been reported in the context of PV system degradation analysis, making this study a novel and relevant contribution. In summary, the main contribution of this paper is the development of a hybrid methodology for PV panel reliability analysis under uncertainty, combining FTA, Fuzzy logic, and Pareto prioritization. This approach offers a new perspective on the identification and classification of degradation modes in PV systems and facilitates the implementation of risk-informed maintenance strategies. This paper is organized in six sections. After the introduction section, Section 2 explains the suggested methods for evaluating the PV panel’s reliability. Section 3 reviews the various degradation modes observed throughout the PV panel’s operating lifetime. In section 4, FFTA is utilized to determine the fundamental causes of PV panel degradation (TE), illustrate the logical relationship between these BEs and TE, and then apply expert judgment to calculate the probability of TE. Section 5 proposes the implementation of Pareto Chart that enables a focused analysis, by prioritizing the most significant causes contributing to degradation of PV panels. This study is completed by proposing some corrective actions or preventive measures to eliminates or reduce the likelihood of failures in PV panels. Finally, conclusion remarks based on the obtained results are given in Section 6.
2 Materials and methods
In the photovoltaic field, qualitative and quantitative assessment of PV panel degradation is very difficult due to lack of information, which can be overcome by the combination of FTA, Fuzzy Logic, and Pareto Chart methodologies. These combined methodologies allow a comprehensive approach of the complex interactions within the PV panel system, enabling the identification of critical causes, the assessment of uncertainties, and the prioritization of corrective measures. The main steps in our reliability assessment and corrective action planning process are shown in Fig.1.
Step 1: This step involves reviewing the various PV panel degradation modes and investigating their possible causes. To find potential modes of degradation, this entails examining maintenance records, pertinent literature, and historical performance data. The goal is to create a comprehensive list of degradation causes, including environmental conditions, material degradation, and operational stressors, laying the groundwork for subsequent analyses.
Step 2: Elaborate the fault tree, a powerful engineering tool shows all potential occurrences and causes of PV panels degradation regarding component and subsystem breakdown. To compute the Failure Probability (FPr) of TE, experts’ opinions for BEs must be collect using linguistic terms. After that, fuzzy sets are created from the linguistic terms and the aggregate results of the experts’ judgments R ̃AG are determined. The aggregated expert judgment is defuzzified by calculating the Fuzzy Possibility (FPs) of each BE. After the defuzzifing stage, the obtained FPs is converted into Fuzzy Probabilities (FPr). Using FTA and the obtained FPr of BEs, the fuzzy probabilities of IEs and TE are quantified.
Step 3: The implementation of Pareto Chart Analysis to prioritize critical causes of PV panel degradation based on their combined impact and probability. The 80% of causes contributing to degradation that warrant immediate attention and corrective action are identified by the Pareto Chart, which graphically depicts the key contributors. Specific corrective measures are suggested in this step to address the critical causes identified in the PV panel degradation analysis. These suggestions, which are based on the Degradation Analysis and Pareto Chart prioritizing, cover technological enhancements, operational modifications, and targeted maintenance protocols.
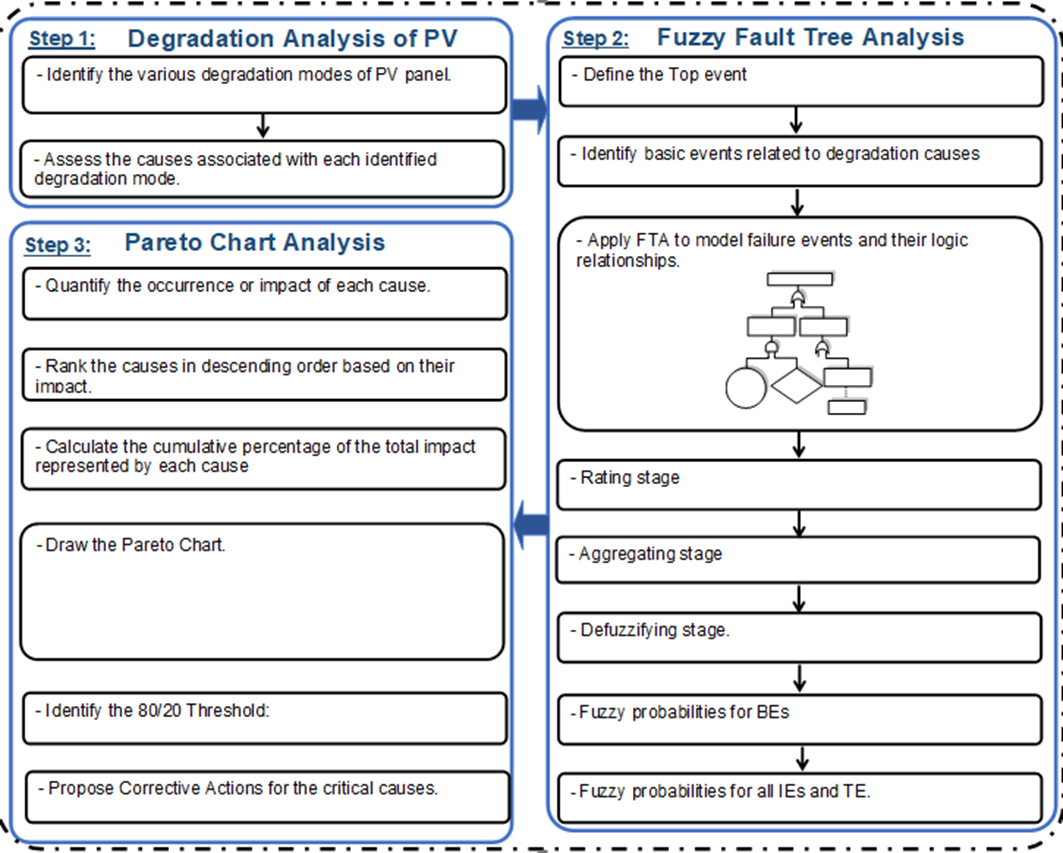
Fig. 1. Flowchart of the reliability assessment methodology
2.1 Degradation analysis of photovoltaic panel
A PV panel’s degradation is the gradual deterioration of its properties that could compromise its capacity to operate within acceptable bounds.
PV panel is considered degraded when its power reaches a level below 80% of its initial value, or when a safety problem occurs; the PV panel is considered deteriorated. When the power of a PV panel falls below 80% of its initial value or a safety issue occurs. Manufacturing defects and severe service conditions such as: temperature, humidity, ultra-violet (UV) irradiation are the main causes of the PV panel’s performance aging [12]. Every one of these factors has the potential to cause one or more aging modes, including discoloration of the encapsulant, delamination, corrosion, hot spots, and snail track [13]. Discoloration of the encapsulant: The discoloration of encapsulant is the change in its color which can result in either yellowing or browning of the encapsulant material. It results in a modification of the encapsulated cells ’transmittance and in the chemical structure of the polymer, consequently, a reduction of the generated current [14]. The discoloration is most likely the result of internal variables like inadequate cell-glas adhesion and poor encapsulant quality or external factors such as UV irradiation and high humidity [15]. Inadequate cell-glass adhesion can be due to the failure of glass or cell. Glass brakes or cracks are very common when PV panels are being transported, installed or maintained [16]. It can also be due to thermal stresses at high temperature of a cell and mechanical stresses induced by the wind (pressure and vibrations) and the snow (pressure). However, even if there is a greater chance of electric shock and moisture intrusion, a PV panel with cracks or breaks may still produce electricity. Discoloration of the encapsulant: The loss of adhesion between cells and glass or between cells and the enclosing polymer is shown in delamination. Delamination raises the risk of reserve polarization heating and disrupts effective heat dissipation [17]. It is a serious issue since it results in two things: more light reflection and water seeping into the PV panel’s construction. Water combined with high voltage can cause significant damage to cell components causing the failure of PV panel. Delamination is more prevalent in hot, humid environments [13]. In addition, delamination occurs if adhesion is insufficient due to failure of the glass or the cell. Failure at the cell level is caused by the no cohesion of the metal contacts, oxidation of the connectors, anomaly in the PN junction or micro-cracks at the cell level [18]. In a PV panel based on crystalline silicon, the cells have a thickness of 220μm or less, thus they are very fragile and brittle. Encapsulant delamination is one of the main ways that PV panels deteriorate. It happens at the contact between the glass cover and the encapsulant as well as between the encapsulant and the solar cell’s front surface [19]. EVA (ethylene vinyl acetate) makes up the encapsulant, which is heated and laminated for a specific amount of time. Delamination is the result of improper processing and the use of inexpensive material [20]. Corrosion: A serious degradation mode called corrosion targets the metal connections between the PV panel’s cells, increasing leakage currents and ultimately lowering performance. The PV panel deteriorates due to corrosion of the conductive components of cells and interconnects through the encapsulant. The humidity in the PV panel has a strong impact on its degradation rate, and more particularly in hot and humid geographical areas. Moisture entering the PV panel due to the failure of interconnection ribbons causes corrosion. In a PV panel made up of interconnected silicon cells, there may be weakened interconnecting cells or ribbons or even broken connections. The welding breakages between cell interconnect ribbons are common due to mechanical stresses. Physical constraint during transport and the presence of a partially shaded cell will accelerate the breakage of the interconnection ribbon especially at the bend region and folds, where little resistant to thermo mechanical fatigue. Moisture penetration is also a recurring problem on junction boxes due to the failure of junction boxes or an insufficient fixation of the junction box on the back-sheet. In the long term, corrosion of connections and interconnections will occur [20]. Hot spots: Shading or degradation of one of the cells placed in series may result a significant drop in the current generated by the PV panel. The cell voltage turns negative and acts as a receiver when the provided current exceeds the current generated by the malfunctioning or poorly illuminated cell. A high heat dissipation is appeared which can lead to destruction of cell, that is called "hot-spot" phenomenon [21]. Among the factors that favoring the appearance of hot-spots phenomenon: inhomogeneous sunlight, dust deposits and deposits of dead leaves.
Snail track: Snail track is a pattern in the shape of a snail trace on the glass in contact with the metallization. The moisture penetrates through the back-sheet and reaches the surface of the cell by the edges or through the micro-cracks. Thus, a gray or black discoloration of the silver paste used for the screen-printed contact grid on the front of the cell is appearing. The spread of snail tracks is faster in hot climates. PV panels affected by snail tracks generally have high leakage currents, but the snail track phenomenon does not directly cause a loss of power.
2. 2Fuzzy fault tree analysis
2.2.1 Fault tree analysis
To systematically evaluate the degradation mechanisms of PV panels, a standardized FTA approach is employed. This methodology enables the identification and hierarchical organization of all potential root causes contributing to PV panel failures. The complete fault tree structure, illustrating the logical relationships between the TE and its contributing Basic Events (BEs), is depicted in Fig.2. Each BE represents a specific degradation cause, as detailed in Table1. This structured representation facilitates a comprehensive understanding of the failure pathways and supports the subsequent reliability evaluation.
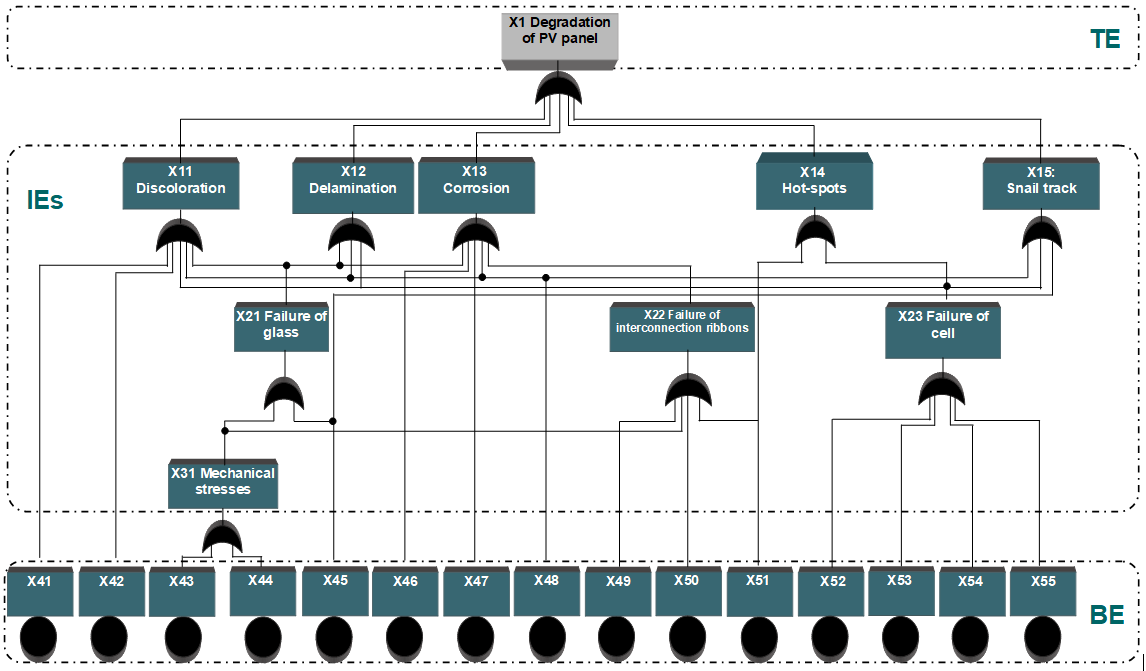
Fig. 2. Fault tree of PV panel degradation
One of the main obstacles to quantitative investigation of PV panel degradation is data insufficiency; expert judgment can be an alternative solution. Therefore, the approach adopted below is to exploit fuzzy logic for the different probabilities associated with BEs to assess the failure occurrence probability of PV panel.
Table 1. BEs of PV panel degradation
|
N° |
Potential failures |
N° |
Potential failures |
|
X41 |
UV irradiation |
X48 |
Humidity |
|
X42 |
Poor quality of the encapsulant |
X49 |
Physical constraint |
|
X43 |
Snow |
X50 |
Temperature changes |
|
X44 |
Wind |
X51 |
Partially shaded cell |
|
X45 |
High temperature |
X52 |
Micro-cracks at the cell |
|
X46 |
Failure of junction box |
X53 |
Anomaly in the PN junction |
|
X47 |
Insufficient fixation of the junction box on back sheet |
X54 |
Oxidation of the connectors |
|
X55 |
No cohesion of the metal contacts |
2.3 Fuzzy reliability estimation
In FTA, the BEs play vital role in initiating a chain of events to calculate the failure likelihood of TE. Due to the lack of BEs probability data, their failure possibilities are determined in this study, from experts who have enough experiences on the photovoltaic field. Then, they are converted to obtain the Fuzzy probabilities for BEs, IEs and TE.
2.3.1 Rating stage
During the rating stage, the experts express their judgment for each BE using linguistic terms, which are modeled by a proper membership function. Five linguistic terms are used (Very low, Low, Medium, High, and Very High) in this study for performing the subjective assessment of BEs. These linguistic terms are fuzzified using triangular or trapezoidal membership functions. Formulas for the triangular membership function μA(x) are as follows in equation (1) - [22, 23].
 |
(1) |
Where a, b and c are triangular fuzzy set numbers. The equation (2) can be used to characterize the trapezoidal membership function μA(x).
 |
(2) |
The membership functions utilized to ascertain experts’ opinions regarding BEs are introduced in Fig.3. The conversion of every triangle fuzzy number into its equivalent trapezoidal fuzzy number is done to make the analysis easier. The trapezoidal fuzzy sets and linguistic terms are shown in Table 2.
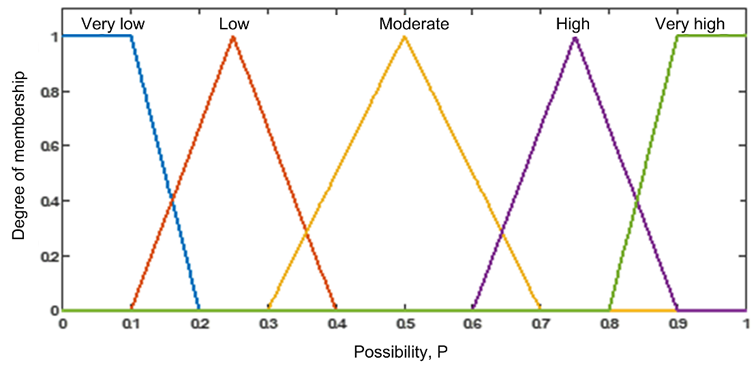
Fig. 3. Fuzzy membership functions
Table 2. Linguistic terms and fuzzy
|
Linguistic terms |
Fuzzy sets (, ,, ) |
|
Very Low (VL) |
(0, 0, 0.1, 0.2) |
|
Low (L) |
(0.1, 0.25, 0.25, 0.4) |
|
Medium (M) |
(0.3, 0.5, 0.5, 0.7) |
|
High(H) |
(0.6, 0.75, 0.75, 0.9) |
|
Very High (VH) |
(0.8, 0.9,1, 1) |
3 Result and discussion
To gathering possibilities of the BEs, five experts participated in the survey whose profiles included PHD, engineer and Master as detailed in Table 3.
Table 3. Details of experts
|
Expert |
Professional Position |
Years experienced |
Education level |
|
1 |
Engineer |
18 years |
PHD |
|
2 |
Engineer |
16 years |
Engineer |
|
3 |
Engineer |
8 years |
Engineer |
|
4 |
Engineer |
5 years |
Master |
|
5 |
Technician |
4 years |
Bachelor |
Since the experts have different profiles, their opinion may not be equal and influenced by their education level, professional position, years of experience, institutional and intellectual background of knowledge in the photovoltaic field. Therefore, it is important to introduce the weights scores of experts to enhance the precision rate of the evaluation [22, 23]. Table 4 expresses the weighting scores of non-homogeneous experts.
Table 4. Weighting scores of non-homogenous experts
|
Group |
Professional Position |
Year Experienced |
Education Level |
Score |
|
Classification |
Senior academic |
≥16years |
PHD |
5 |
|
Junior academic |
11-15 |
Master |
4 |
|
|
Engineer |
6-10 |
Engineer |
3 |
|
|
Technician |
3-5 |
Bachelor |
2 |
|
|
Worker |
≤2 |
Baccalaureate |
1 |
Considering the aforementioned, Table 5 shows how the weights of experts’ scores are determined by their years of expertise in a PV field, professional position, and educational foundation.
Table 5. Experts’ weight scores
|
No of Expert |
Title |
Years experienced |
Education level |
Weighting factor |
Weighting score W(Eu) |
|
1 |
Engineer |
≥16 |
PHD |
3+5+5=13 |
0.2708 |
|
2 |
Engineer |
≥16 |
Engineer |
3+5+3=11 |
0.2292 |
|
3 |
Engineer |
6-10 |
Engineer |
3+3+3=9 |
0.1875 |
|
4 |
Engineer |
3-5 |
Master |
3+2+4=9 |
0.1875 |
|
5 |
Technician |
3-5 |
Bachelor |
2+2+2=6 |
0.1250 |
|
Total |
48 |
1 |
|||
After calculating the weights scores of experts, their opinions for each BE based on their backgrounds and experiences are expressed using linguistic terms as given in Table 6.
Table 6. Linguistic judgments of experts for BEs
|
|
Expert 1 |
Expert 2 |
Expert 3 |
Expert 4 |
Expert 5 |
|
X41 |
M |
M |
VH |
VH(H) |
H |
|
X42 |
L |
VL |
VL |
VL |
M |
|
X43 |
VL |
L |
L |
L |
M |
|
X44 |
M |
VL |
VL |
L |
VL |
|
X45 |
H |
M |
M |
H(M) |
M |
|
X46 |
M |
L |
L |
VL |
VH |
|
X47 |
M |
VL |
L |
VL |
M |
|
X48 |
VL |
VL |
L |
H |
VL |
|
X49 |
L |
L |
L |
VL |
M |
|
X50 |
L |
L |
VL |
VL |
VL |
|
X51 |
H |
M |
M |
M(L) |
H |
|
X52 |
M |
L |
L |
VL |
L |
|
X53 |
VL |
VL |
L |
VL |
H(M) |
|
X54 |
M |
L |
L |
L |
H(M) |
|
X55 |
L |
L |
VL |
VL |
L |
3.1 Aggregating stage
Expert views must be compiled to obtain a consensus after gathering expert judgments for BEs utilizing linguistic terms and introducing their appropriate fuzzy set.
For this, it is required to calculate the degree of agreement for each pair of experts, the Average Agreement degree (AA), Relative Agreement (RA) degree, the Consensus Coefficient (CC) degree in this stage. The agreement degree of opinions means the degree of similarity between two standard fuzzy numbers, representing experts ‘ratings. It can be obtained by adopting the following similarity function "S" in equation (3) - [22, 23]:
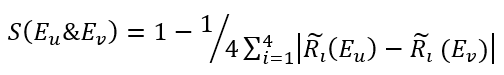 |
(3) |
Two experts provided two trapezoidal fuzzy numbers , and . Equation (3) yielded the similarity function and matching similarity value for X41, which are shown in Table 7.
Table 7. Similarity function and similarity value for X41
|
|
Fuzzy sets |
|||
|
Expert 1 (E1) |
0.3 |
0.5 |
0.5 |
0.7 |
|
Expert 2 (E2) |
0.3 |
0.5 |
0.5 |
0.7 |
|
Expert 3 (E3) |
0.8 |
0.9 |
1 |
1 |
|
Expert 4 (E4) |
0.6 |
0.75 |
0.75 |
0.9 |
|
Expert 5 (E5) |
0.6 |
0.75 |
0.75 |
0.9 |
|
N° |
Similarity function |
Value |
||
|
1 |
S(E1&E2) |
1 |
||
|
2 |
S(E1&E3) |
0.575 |
||
|
3 |
S(E1&E4) |
0.750 |
||
|
4 |
S(E1&E5) |
0.750 |
||
|
5 |
S(E2&E3) |
0.575 |
||
|
6 |
S(E2&E4) |
0.750 |
||
|
7 |
S(E2&E5) |
0.750 |
||
|
8 |
S(E3&E4) |
0.825 |
||
|
9 |
S(E3&E5) |
0.825 |
||
|
10 |
S(E4&E5) |
1 |
||
To facilitate the calculation of agreement degree for each BE, Table 8 introduces the similarity value between two linguistic terms.
Table 8. Similarity value between two linguistic terms
|
Linguistic terms |
VL |
L |
M |
H |
VH |
|
VL |
1 |
0.825 |
0.575 |
0.325 |
0.150 |
|
L |
0.825 |
1 |
0.750 |
0.500 |
0.325 |
|
M |
0.575 |
0.750 |
1 |
0.750 |
0.575 |
|
H |
0.325 |
0.500 |
0.750 |
1 |
0.825 |
|
VH |
0.150 |
0.325 |
0.575 |
0.825 |
1 |
Table 9. Similarity function and similarity value for BEs
|
EEs |
Similarity function |
|||||||||
|
S(E1&E2) |
S(E1&E3) |
S(E1&E4) |
S(E1&E5) |
S(E2&E3) |
S(E2&E4) |
S(E2&E5) |
S(E3&E4) |
S(E3&E5) |
S(E4&E5) |
|
|
X41 |
1 |
0.575 |
0.750 |
0.750 |
0.575 |
0.750 |
0.750 |
0.825 |
0.825 |
1.000 |
|
X42 |
0.825 |
0.825 |
0.825 |
0.750 |
1.000 |
1.000 |
0.575 |
1.000 |
0.575 |
0.575 |
|
X43 |
0.825 |
0.825 |
0.825 |
0.575 |
1.000 |
1.000 |
0.750 |
1.000 |
0.750 |
0.750 |
|
X44 |
0.575 |
0.575 |
0.750 |
0.575 |
1.000 |
0.825 |
1.000 |
0.825 |
1.000 |
0.825 |
|
X45 |
0.750 |
0.750 |
0.750 |
0.750 |
1.000 |
1.000 |
1.000 |
1.000 |
1.000 |
1.000 |
|
X46 |
0.750 |
0.750 |
0.575 |
0.575 |
1.000 |
0.825 |
0.325 |
0.825 |
0.325 |
0.150 |
|
X47 |
0.575 |
0.750 |
0.575 |
1.000 |
0.825 |
1.000 |
0.575 |
0.825 |
0.750 |
0.575 |
|
X48 |
1.000 |
0.825 |
0.325 |
1.000 |
0.825 |
0.325 |
1.000 |
0.500 |
0.825 |
0.325 |
|
X49 |
1.000 |
1.000 |
0.825 |
0.750 |
1.000 |
0.825 |
0.750 |
0.825 |
0.750 |
0.575 |
|
X50 |
1.000 |
0.825 |
0.825 |
0.825 |
0.825 |
0.825 |
0.825 |
1.000 |
1.000 |
1.000 |
|
X51 |
0.750 |
0.750 |
0.750 |
1.000 |
1.000 |
1.000 |
0.750 |
1.000 |
0.750 |
0.750 |
|
X52 |
0.750 |
0.750 |
0.575 |
0.750 |
1.000 |
0.825 |
1.000 |
0.825 |
1.000 |
0.825 |
|
X53 |
1.000 |
0.825 |
1.000 |
0.325 |
0.825 |
1.000 |
0.325 |
0.825 |
0.500 |
0.325 |
|
X54 |
0.750 |
0.750 |
0.750 |
1.000 |
1.000 |
1.000 |
0.750 |
1.000 |
0.750 |
0.750 |
|
X55 |
1.000 |
0.825 |
0.825 |
1.000 |
0.825 |
0.825 |
1.000 |
1.000 |
0.825 |
0.825 |
The average agreement degree of experts AA(Eu), Eu (u=1, 2,...,M) is calculated by averaging the degrees of similarity of each expert (u) with respect to other experts using equation (4):
| (4) |
Where M is the number of experts, Eu and Ev are the two fuzzy trapezoidal numbers selected by experts’ u and v.
The relative agreement degree RA(Eu) of each expert is calculated by dividing his average agreement degree AA(Eu) with the other experts, by the sum of the average agreement degree of all the experts, using equation (5):
| (5) |
The consensus coefficient degree of each expert CC(Eu) combines the relative agreement degree RA(Eu) of each expert with their weighting score W(Eu) using equation (6):
| (6) |
Where:
β (0 ≤β ≤1): Relaxation factor that shows the importance w(Eu) over RA(Eu).
β = 0 when a homogeneous group of experts is used, so no importance is given to the weight of an expert. An expert’s consensus degree and important weight are equal when β = 1. In this study, the five experts are considered as identical and hence β is nominated as 0.5.
The aggregated result of the experts’ judgments , is the sum of the multiplication of the consensus coefficient degree CC(Eu) of each expert by the fuzzy number , which represents its fuzzy note, using equation (7):
| (7) |
Table 10 illustrates the detailed aggregation calculations for X41 such as Average degree of Agreement (AA), Relative degree of Agreement (RA) and consensus coefficient (CC) of each expert. The aggregation calculations for all BEs are presented in Table 11.
Table 10. AA, RA, CC and Aggregation calculations for X41
|
Experts |
AA |
RA |
CC |
Fuzzy sets |
|||
|
|
|
|
|
||||
|
E1 |
0.725 |
0.192 |
0.231 |
0.3 |
0.5 |
0.5 |
0.7 |
|
E2 |
0.725 |
0.192 |
0.211 |
0.3 |
0.5 |
0.5 |
0.7 |
|
E3 |
0.744 |
0.197 |
0.192 |
0.8 |
0.9 |
1 |
1 |
|
E4 |
0.788 |
0.209 |
0.198 |
0.6 |
0.75 |
0.75 |
0.9 |
|
E5 |
0.788 |
0.209 |
0.167 |
0.6 |
0.75 |
0.75 |
0.9 |
|
Aggregation for X41: |
0.505 |
0.667 |
0.686 |
0.829 |
|||
Table 11. Aggregated expert judgments for BEs
|
|
X41 |
X42 |
X43 |
X44 |
X45 |
X46 |
X47 |
X48 |
|
|
AA |
E1 |
0.725 |
0.806 |
0.763 |
0.619 |
0.813 |
0.663 |
0.725 |
0.788 |
|
E2 |
0.725 |
0.850 |
0.894 |
0.850 |
0.875 |
0.725 |
0.744 |
0.788 |
|
|
E3 |
0.744 |
0.850 |
0.894 |
0.850 |
0.875 |
0.725 |
0.788 |
0.744 |
|
|
E4 |
0.788 |
0.850 |
0.894 |
0.806 |
0.875 |
0.594 |
0.744 |
0.369 |
|
|
E5 |
0.788 |
0.619 |
0.706 |
0.850 |
0.875 |
0.344 |
0.725 |
0.788 |
|
|
RA |
E1 |
0.192 |
0.203 |
0.184 |
0.156 |
0.188 |
0.217 |
0.195 |
0.227 |
|
E2 |
0.192 |
0.214 |
0.215 |
0.214 |
0.202 |
0.238 |
0.200 |
0.227 |
|
|
E3 |
0.197 |
0.214 |
0.215 |
0.214 |
0.202 |
0.238 |
0.211 |
0.214 |
|
|
E4 |
0.209 |
0.214 |
0.215 |
0.203 |
0.202 |
0.195 |
0.200 |
0.106 |
|
|
E5 |
0.209 |
0.156 |
0.170 |
0.214 |
0.202 |
0.113 |
0.195 |
0.227 |
|
|
CC |
E1 |
0.231 |
0.237 |
0.228 |
0.213 |
0.229 |
0.244 |
0.233 |
0.249 |
|
E2 |
0.211 |
0.222 |
0.222 |
0.222 |
0.215 |
0.233 |
0.214 |
0.228 |
|
|
E3 |
0.192 |
0.201 |
0.201 |
0.201 |
0.195 |
0.213 |
0.199 |
0.201 |
|
|
E4 |
0.198 |
0.201 |
0.201 |
0.195 |
0.195 |
0.191 |
0.194 |
0.147 |
|
|
E5 |
0.167 |
0.140 |
0.148 |
0.169 |
0.163 |
0.119 |
0.160 |
0.176 |
|

|
1 |
0.505 |
0.066 |
0.107 |
0.162 |
0.367 |
0.213 |
0.138 |
0.108 |
|
2 |
0.667 |
0.129 |
0.230 |
0.155 |
0.571 |
0.340 |
0.246 |
0.160 |
|
|
3 |
0.686 |
0.192 |
0.253 |
0.215 |
0.571 |
0.371 |
0.287 |
0.226 |
|
|
4 |
0.829 |
0.318 |
0.399 |
0.346 |
0.571 |
0.506 |
0.436 |
0.343 |
|
|
|
X49 |
X50 |
X51 |
X52 |
X53 |
X54 |
X55 |
|
|
|
AA |
E1 |
0.894 |
0.869 |
0.812 |
0.706 |
0.788 |
0.750 |
0.913 |
|
|
E2 |
0.894 |
0.869 |
0.875 |
0.894 |
0.788 |
0.813 |
0.913 |
|
|
|
E3 |
0.894 |
0.913 |
0.875 |
0.894 |
0.744 |
0.813 |
0.869 |
|
|
|
E4 |
0.763 |
0.913 |
0.875 |
0.763 |
0.788 |
0.813 |
0.869 |
|
|
|
E5 |
0.706 |
0.913 |
0.812 |
0.894 |
0.369 |
0.750 |
0.913 |
|
|
|
RA |
E1 |
0.215 |
0.194 |
0.191 |
0.170 |
0.226 |
0.200 |
0.204 |
|
|
E2 |
0.215 |
0.194 |
0.206 |
0.215 |
0.226 |
0.217 |
0.204 |
|
|
|
E3 |
0.215 |
0.204 |
0.206 |
0.215 |
0.214 |
0.217 |
0.194 |
|
|
|
E4 |
0.184 |
0.204 |
0.206 |
0.184 |
0.227 |
0.217 |
0.194 |
|
|
|
E5 |
0.170 |
0.204 |
0.191 |
0.215 |
0.106 |
0.150 |
0.204 |
|
|
|
CC |
E1 |
0.243 |
0.232 |
0.231 |
0.220 |
0.249 |
0.235 |
0.237 |
|
|
E2 |
0.222 |
0.212 |
0.218 |
0.222 |
0.228 |
0.223 |
0.217 |
|
|
|
E3 |
0.201 |
0.196 |
0.197 |
0.201 |
0.201 |
0.202 |
0.191 |
|
|
|
E4 |
0.186 |
0.196 |
0.197 |
0.186 |
0.207 |
0.202 |
0.191 |
|
|
|
E5 |
0.148 |
0.164 |
0.158 |
0.170 |
0.116 |
0.138 |
0.164 |
|
|
|
|
1 |
0.111 |
0.044 |
0.417 |
0.126 |
0.089 |
0.216 |
0.062 |
|
|
2 |
0.240 |
0.111 |
0.597 |
0.259 |
0.137 |
0.378 |
0.155 |
|
|
|
3 |
0.259 |
0.167 |
0.597 |
0.277 |
0.205 |
0.378 |
0.193 |
|
|
|
4 |
0.407 |
0.289 |
0.779 |
0.429 |
0.321 |
0.539 |
0.324 |
|
|
3.2 Defuzzification stage
In this stage, the aggregate results of the experts’ judgments must be defuzzified to obtain a quantifiable result in fuzzy logic. For the defuzzification process, the center of area method is applied. The defuzzified output X* can be obtained by equation (8):
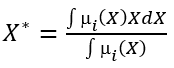 |
(8) |
Where X states the output variable and μi(X) is the aggregated membership function. For the trapezoidal fuzzy numbers, the defuzzified output X* can be express by equation (9):
| (9) |
Using equation (9) with ai=(R_AGi ) ̃, the defuzzified failure possibilities (FPs) for each BE are calculated and presented in Table12.
Table 12. Aggregated expert judgments and defuzzified failure possibilities for BEs
|
BEs |
Aggregated expert judgments 𝑅_𝐴𝐺 |
Failure possibility (FPs) |
|||
|
|
𝑅_𝐴𝐺1 |
𝑅_𝐴𝐺2 |
𝑅_𝐴𝐺3 |
𝑅_𝐴𝐺4 |
|
|
X41 |
0.505 |
0.667 |
0.686 |
0.829 |
0.670 |
|
X42 |
0.066 |
0.129 |
0.192 |
0.318 |
0.179 |
|
X43 |
0.107 |
0.230 |
0.253 |
0.399 |
0.249 |
|
X44 |
0.162 |
0.155 |
0.215 |
0.346 |
0.215 |
|
X45 |
0.367 |
0.571 |
0.571 |
0.571 |
0.502 |
|
X46 |
0.213 |
0.340 |
0.371 |
0.506 |
0.358 |
|
X47 |
0.138 |
0.246 |
0.287 |
0.436 |
0.279 |
|
X48 |
0.108 |
0.160 |
0.226 |
0.343 |
0.212 |
|
X49 |
0.111 |
0.240 |
0.259 |
0.407 |
0.256 |
|
X50 |
0.044 |
0.111 |
0.167 |
0.289 |
0.156 |
|
X51 |
0.417 |
0.597 |
0.597 |
0.779 |
0.597 |
|
X52 |
0.126 |
0.259 |
0.277 |
0.429 |
0.274 |
|
X53 |
0.089 |
0.137 |
0.205 |
0.321 |
0.191 |
|
X54 |
0.216 |
0.378 |
0.378 |
0.539 |
0.378 |
|
X55 |
0.062 |
0.155 |
0.193 |
0.324 |
0.186 |
After determining the Failure Possibilities (FPs) of each BEs from the experts’ judgments, they are converted into Fuzzy Probabilities rate (FPr) using equations (10):
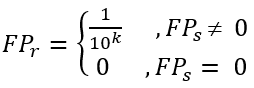 |
(10) |
| (11) |
Where K is a constant expressing the safety criterion based on the lower bound of the error rate (5 × 10⁻⁵) and the error rate of a routine human operation (10−2 ~ 10−3) [22, 23]. Table 13 shows the occurrence probabilities of each BE.
Table 13. Fuzzy probability of all BEs
|
BEs |
Fuzzy probability (FPr) |
BEs |
Fuzzy probability (FPr) |
|
X41 |
15.240E-03 |
X49 |
0.519E-03 |
|
X42 |
0.150E-03 |
X50 |
0.091E-03 |
|
X43 |
0.472E-03 |
X51 |
9.600E-03 |
|
X44 |
0.288E-03 |
X52 |
0.655E-03 |
|
X45 |
5.081E-03 |
X53 |
0.190E-03 |
|
X46 |
1.605E-03 |
X54 |
1.913E-03 |
|
X47 |
0.698E-03 |
X55 |
0.170E-03 |
|
X48 |
0.274E-03 |
In FFTA, the IEs are the output of the connection of BEs through OR gate. In this aspect, the failures probabilities for IEs can be calculated using the obtained failures probabilities (FPr) of BEs (Table 14).
The fuzzy probability of mechanical stresses is obtained by applying the equation (12):
| (12) |
The fuzzy probability of the glass failure can be evaluated according to equation (13):
| (13) |
The fuzzy probability of the failure of interconnection ribbons is given by equation (14):
| (14) |
The fuzzy probability of cell failure is calculated based on equation (15):
| (15) |
The fuzzy probability of the discoloration of PV panel is outlined in equation (16):
| (16) |
The fuzzy probability of the delamination of PV panel according to the formulation in equation (17):
| (17) |
The fuzzy probability of the corrosion of PV panel can be computed using equation (18):
| (18) |
The fuzzy probability of Hot spots is given by equation (19):
| (19) |
The fuzzy probability of the Snail track can be evaluated using equation (20):
| (20) |
The determination of the IEs leads to determine the top event X1 as expressed by the equation (21):
| (21) |
Using FFTA, the occurrence probability of TE (degradation of PV panel) is calculated as 73.671E-03 (0.073). This means that 7 to 8 out of 100 PV panels may undergo to the degradation due to the operational constraints. X11: Discoloration (24.429E-03) and X13: Corrosion (19.388E-03) are the crucial events that are influencing the TE’ failure probability. In view of the results, the following important BEs has a significant impact on the TE: X41: UV irradiation (15.240E-03), X51: Partially shaded cell (9.600E-03), X45: High temperature (5.841E-03), X54: Oxidation of the connectors (1.913E-03) and X46: Failure of junction box (1.605E-03). After computing the occurrence probability of TE and IEs, consequences analysis is performed in the next section to complete detailed risk assessment for PV panel degradation on a standalone PV system in rural area.
Table 14. Fuzzy probability of IEs and TE
|
|
Fuzzy probability (FPr) |
|
|
IEs |
X31 |
0.760E-03 |
|
X21 |
10.853E-03 |
|
|
X22 |
10.970E-03 |
|
|
X23 |
2.928E-03 |
|
|
X11 |
24.429E-03 |
|
|
X12 |
9.043E-03 |
|
|
X13 |
19.388E-03 |
|
|
X14 |
12.528E-03 |
|
|
X15 |
8.283E-03 |
|
|
TE |
X1 |
73.671E-03 |
In order to quantify the reliability of photovoltaic (PV) panels, the probability of degradation was used as a fundamental measure. The equation (22) can be used to determine the reliability R of a PV panel can be calculated using the formula:
| (22) |
Thus, the reliability R of the PV panels is approximately 92.63%. This indicates a high likelihood of the panels maintaining their performance over the observed period.
3.3 Pareto Chart Analysis
In this section, the fuzzy FTA is completed by a Pareto Chart analysis, a structured approach [24] to identify and address the most significant causes of PV panel degradation, contributing to effective corrective actions and continuous improvement. As a quantitative indicator of the probability that each cause contributed to the overall degradation, the FPr values are used. Then, the identified causes are ranked in descending order according to their probabilities. This step sets the stage for visual representation on the Pareto Chart. As seen in Table 15, the cumulative percentage of the total impact for each cause denoted by "FPr-p" is calculated.
Table 15. Pareto Analysis
|
Rank |
Cause |
FPr |
FPr-p |
|
1 |
X41 |
18.900E-03 |
41.518% |
|
2 |
X45 |
10.093E-03 |
63.525% |
|
3 |
X51 |
9.600E-03 |
84.614% |
|
4 |
X54 |
1.913E-03 |
88,793 |
|
5 |
X46 |
1.605E-03 |
92,312 |
|
6 |
X47 |
0.698E-03 |
93,842 |
|
7 |
X52 |
0.655E-03 |
95,278 |
|
8 |
X49 |
0.519E-03 |
96,415 |
|
9 |
X43 |
0.472E-03 |
97,450 |
|
10 |
X44 |
0.288E-03 |
98,081 |
|
11 |
X48 |
0.274E-03 |
98,682 |
|
12 |
X53 |
0.190E-03 |
99,099 |
|
13 |
X55 |
0.170E-03 |
99,471 |
|
14 |
X42 |
0.150E-03 |
99,800 |
|
15 |
X50 |
0.091E-03 |
100 |
As seen in Fig.4, the Pareto chart provides a clear graphical representation of the relative significance of each BE. Each bar indicates the contribution of an individual BE to the total failure probability, while the cumulative percentage “FPr_p” on the secondary axis highlights the progressive accumulation of degradation impact. The analysis reveals that two key causes, X41 and X45, together account for approximately 84.6% of the total failure probability. This result underscores their predominant role in the overall degradation process and points to these two factors as priority targets for corrective actions.

Fig. 4. Chart with 80% Marker
Using UV-resistant coatings is one practical way to mitigate the harmful effects of UV radiation (X41) on PV panels. By acting as a barrier, these coatings can protect panels from the damaging effects of repeated exposure to UV light. These materials, such as fluoropolymer films (e;g;ETFE (Ethylene Tetrafloroethylene)) are already available on the market and compatible with existing PV encapsulation process, making this solution economically and technically feasible. Research indicates that such coatings can reduce the degradation rate of PV panels by approximately 15-30% under high UV exposure, enhancing the durability and performance over time [25]. Optimizing the panels' tilt and alignment is another option to take into account. This involves adjusting the angle and direction of the panels to minimize direct exposure to intense sunlight, further enhancing their durability and longevity. This measure can be easily integrated during system installation using simulation tools like PV system or SAM, with minimal additional cost. Implementing these measures not only addresses the specific cause of UV irradiation but also contributes to overall improvements in the reliability and performance of the PV system. The challenge of high temperatures (X45) affecting PV panels can be addressed by implementing enhanced ventilation and cooling systems is a prudent approach. These systems can effectively regulate the temperature of panels, especially during peak heat periods. Studies have shown that cooling systems such as active ventilation or heat sinks can reduce the temperature effects by 20-30% during peak heat periods, thus slowing down the degradation process [26, 27]. In addition, the use of new materials with enhanced thermal properties is another effective strategy. Encapsulants with improved thermal stability (such as modified EVA or polyolefin) are increasingly adopted in commercial PV modules, offering improved resilience without major redesign or cost increases. Combining these corrective measures can contribute to increase the PV system’s dependability and effectiveness. This targeted approach aligns with the principles of reliability centered maintenance and supports the implementation of cost-effective preventive strategies. In addition, routine monitoring and maintenance are essential to validate the long-term effectiveness of these corrective measures and to detect any emerging degradation modes. The bar chart shown in Fig.5 visually compares the failure probability (Fpr) of key causes of PV panel degradation before and after the implementation of corrective actions. As seen in the chart X41, which was initially responsible for a failure probability of 18.900E-03, is reduced to 13.230E-03 after applying UV resistant coatings. This demonstrates the significant impact of protective coatings in reducing degradation due to UV exposure. X45, which previously contributed 10.093E-03 to degradation, decreases to 7.065E-03 after implementing thermal management systems such as enhanced cooling and ventilation.
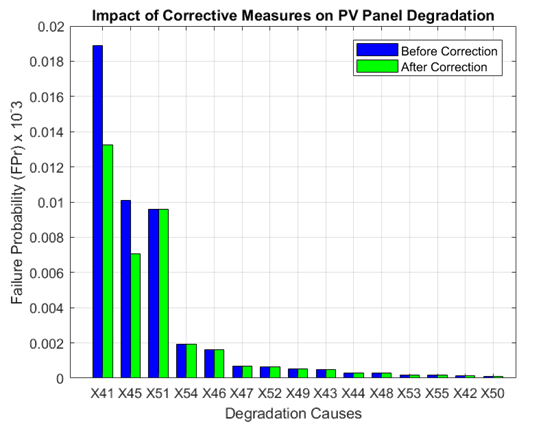
Fig. 5. Impact of corrective measures on reducing PV panel degradation based on pareto analysis
4 Conclusion
Qualitative and quantitative assessment of the PV panel is a critical tool to elaborate a comprehensive identification of all PV panel degradation modes and their causes, as well as its possible consequences. In this context, a reliability and performance analysis of PV panel aging associated with operating limitations using FTA within fuzzy logic environment is presented in this paper. Due to manufacturing defect, severe climatic and operating conditions, mishandling during transportation and installation of PV panel in standalone PV system, various degradation modes were observed over time such as X11: discoloration of the encapsulant, X12: delamination, X13: corrosion, X14: hot spots and X15: Snail track. 15 basic causes have been shown to contribute to different PV panel aging modes, including X41:UV irradiation; X42:Poor quality of the encapsulant; X43:Snow; X44:Wind; X45: High temperature; X46:Failure of junction box; X47:Insufficient fixation of the junction box on the back sheet; X48:Humidity; X49:Physical constraint; X50:Temperature changes; X51:Partially shaded cell; X52:Micro-cracks at the cell; X53:Anomaly in the PN junction; X54:Oxidation of the connectors; X55: No cohesion of the metal contacts. Using FTA, the logical relationship of these BEs with the various degradation modes in leading to the PV panel degradation was displayed. Due to lack of information, shortage of statistical data, ambiguous BEs behavior, a fuzzy reliability estimation was proposed using expert elicitation and incorporating with fuzzy set theory to quantify the Fuzzy Probability rate (FPr) of BEs. Using expert election and fuzzy theory, a fuzzy reliability estimator was suggested to quantify the fuzzy probability rate (FPr) of BEs due to the absence of statistical data, unclear behavior, and lack of knowledge. Through FFTA, it was shown that the likelihood of PV panel degradation occurring was around 97.383E-03. A Pareto chart was created following the FFTA, to highlight the critical causes affecting PV panel, such as UV radiation (X41) and high temperatures (X45), and highlight the significance of implementing preventative measures. Proposed corrective actions include the use of UV-resistant coatings and enhanced ventilation systems to mitigate the impact of UV irradiation and regulate high temperatures. These measures are grounded in practical research findings that suggest UV resistant coatings can reduce degradation caused by UV radiation by up to 50%, and optimized ventilation can mitigate high temperature effects, leading to better panel durability. Through this comprehensive methodology, the study not only enhanced comprehension of the degradation modes of PV panel and their causes but also suggested practical interventions. The combination of FTA, fuzzy methods, and Pareto charts provides a comprehensive approach to improving and evaluating PV panel reliability. In conclusion, this study will help researchers and professionals for minimizing potential risks of PV panel degradation during its manufacturing process, transportation and installation, and operating process in standalone PV system.
Acknowledgements
No external funding was received.
References
- Jordan, D., Silverman, T., Wohlgemuth, J., Kurtz, S., & VanSant, K. (2017). Photovoltaic failure and degradation modes. Progress in Photovoltaics: Research and Applications, 25(4), 318–326. https://doi.org/10.1002/pip.286
- Jawad, A., Ciocia, A., Fichera, S., Murtaza, A. F., & Spertino, F. (2019). Detection of typical defects in silicon photovoltaic modules and application for plants with distributed MPPT configuration. Energies, 12(23), 4547. https://doi.org/10.3390/en12234547
- Colli, A. (2015). Failure mode and effect analysis for photovoltaic systems. Renewable and Sustainable Energy Reviews, 50, 804–809. https://doi.org/10.1016/j.rser.2015.05.056
- Cheliyan, A. S., & Bhattacharyya, S. K. (2018). Fuzzy fault tree analysis of oil and gas leakage in subsea production systems. Journal of Ocean Engineering and Science, 3(1), 38–48. https://doi.org/10.1016/j.joes.2017.11.005
- Jishuoli, L., Kaili, X., Bingjie, F., & Liyan, G. (2020). Risk assessment of oxygen lance burning loss using bow-tie analysis based on fuzzy theory. Mathematical Problems in Engineering, 2020, 7172184. https://doi.org/10.1155/2020/7172184
- Brik, K., & Ben Ammar, F. (2013). Causal tree analysis of depth degradation of the lead acid battery. Journal of Power Sources, 228, 39–46. https://doi.org/10.1016/j.jpowsour.2012.10.088
- Azzouz, I., Yahmadi, R., Brik, K., & Ben Ammar, F. (2022). Analysis of the critical failure modes and developing an aging assessment methodology for lithium iron phosphate batteries. Electrical Engineering, 104(1), 27–43. https://doi.org/10.1007/s00202-021-01320-7
- Vileiniskis, M., & Remenyte-Prescott, R. (2017). Quantitative risk prognostics framework based on Petri Net and Bow-Tie models. Reliability Engineering & System Safety, 165, 62–73. https://doi.org/10.1016/j.ress.2017.03.026
- Lu, L., Liang, W., Zhang, L., Zhang, H., & Shan, J. (2015). A comprehensive risk evaluation method for natural gas pipelines by combining a risk matrix with a bow-tie model. Journal of Natural Gas Science and Engineering, 25, 124–133. https://doi.org/10.1016/j.jngse.2015.04.029
- Zhang, L., Skibniewski, M., Wu, X., Chen, Y., & Deng, Q. (2014). A probabilistic approach for safety risk analysis in metro construction. Safety Science, 63, 8–17. https://doi.org/10.1016/j.ssci.2013.10.016
- Lavasani, S., Ramzali, N., Sabzalipour, F., & Akyuz, E. (2015). Utilisation of fuzzy fault tree analysis (FFTA) for quantified risk analysis of leakage in abandoned oil and natural-gas wells. Ocean Engineering, 108, 729–737. https://doi.org/10.1016/j.oceaneng.2015.09.008
- Lavasani, S., Zendegani, A., & Celik, M. (2015). An extension to fuzzy fault tree analysis (FFTA) application in petrochemical process industry. Process Safety and Environmental Protection, 93, 75–88. https://doi.org/10.1016/j.psep.2014.05.001
- Ndiaye, A., Kébé, C. M. F., Ndiaye, P. A., Charki, A., Kobi, A., & Sambou, V. (2013). A novel method for investigating photovoltaic module degradation. Energy Procedia, 36, 1222–1231. https://doi.org/10.1016/j.egypro.2013.07.138
- Osterwald, C. R., & McMahon, T. J. (2009). History of accelerated and qualification testing of terrestrial photovoltaic modules: A literature review. Progress in Photovoltaics: Research and Applications, 17(1), 11–33. https://doi.org/10.1002/pip.861
- Del Pero, C., Aste, N., Leonforte, F., & Sfolcini, F. (2023). Long-term reliability of photovoltaic c-Si modules – A detailed assessment based on the first Italian BIPV project. Solar Energy, 264, 112074. https://doi.org/10.1016/j.solener.2023.112074
- Spertino, F., Chiodo, E., Ciocia, A., Malgaroli, G., & Ratcli, A. (2021). Maintenance activity, reliability, availability, and related energy losses in ten operating photovoltaic systems up to 1.8 MW. IEEE Transactions on Industry Applications, 57(1). https://doi.org/10.1109/TIA.2020.3031547
- Jeong, J. S., & Park, N. (2013). Field discoloration analysis and UV/temperature accelerated degradation test of EVA for PV. 2013 IEEE 39th Photovoltaic Specialists Conference (PVSC). https://doi.org/10.1109/PVSC.2013.6745095
- Sharma, V., & Chandel, S. S. (2016). A novel study for determining early life degradation of multi-crystalline-silicon photovoltaic modules observed in western Himalayan Indian climatic conditions. Solar Energy, 134, 32–44. https://doi.org/10.1016/j.solener.2016.04.023
- Kaplani, E. (2012). Detection of degradation effects in field-aged c-Si solar cells through IR thermography and digital image processing. International Journal of Photoenergy, 2012, 396792. https://doi.org/10.1155/2012/396792
- Wohlgemuth, J., & Kurtz, S. (2011). Reliability testing beyond qualification as a key component in photovoltaic’s progress toward grid parity. 2011 International Reliability Physics Symposium. https://doi.org/10.1109/IRPS.2011.5784534
- Muñoz, M. A., Alonso-García, M. C., Vela, N., & Chenlo, F. (2011). Early degradation of silicon PV modules and guaranty conditions. Solar Energy, 85(9), 2264–2274. https://doi.org/10.1016/j.solener.2011.06.011
- Cheliyan, A. S., & Bhattacharyya, S. K. (2018). Fuzzy fault tree analysis of oil and gas leakage in subsea production systems. Journal of Ocean Engineering and Science, 3(1), 38–48. https://doi.org/10.1016/j.joes.2017.11.005
- Akyuz, E. (2016). Quantitative human error assessment during abandon ship procedures in maritime transportation. Ocean Engineering, 120, 21–29. https://doi.org/10.1016/j.oceaneng.2016.05.017
- Azzouz, I., Hammami, I., Brik, K., & Ben Ammar, F. (2020, July). Criticality assessment with Pareto diagram of the different solar batteries technologies. In 17th International Multi-Conference on Systems, Signals and Devices (SSD). https://doi.org/10.1109/SSD49366.2020.9364179
- Jäger-Waldau, A. (2022). Photovoltaic status report 2022. European Commission Joint Research Centre.
- Jordan, D. C., & Kurtz, S. R. (2013). Photovoltaic degradation rates – An analytical review. Progress in Photovoltaics: Research and Applications, 21(1), 12–29.
- Pandey, A., Chakrabarti, S., & Daghe, P. (2019). A systematic approach for better thermal management of photovoltaic systems – A review. Journal of Computational & Applied Research in Mechanical Engineering, 10, 1–24.
Conflict of Interest Statement
There are no conflicts affecting the research.
Author Contributions
Data Availability Statement
There is no dataset associated with the study or data is not shared.
Supplementary Materials
There are no supplementary materials to include.