Volume 24 article 1329 pages: 227-243
Received: Sep 22, 2025 Accepted: Mar 06, 2026 Available Online: May 26, 2026 Published: May 31, 2026
DOI: 10.5937/jaes0-61618
VALIDATION OF THE PERFORMANCE OF HDPE-CONCRETE AS AN ALTERNATIVE FOR SUSTAINABLE CONSTRUCTION
Abstract
Concrete is the most widely used material in global construction, which generates high demand for natural resources and a significant carbon footprint. In response to these challenges, incorporating plastic waste, such as high-density polyethylene (HDPE), has been proposed as a sustainable alternative to reduce dependence on natural aggregates and mitigate plastic pollution. This study evaluates the mechanical performance of concrete with partial replacements of HDPE at 2.5%, 5%, 7.5%, 10%, 15%, 20%, and 30% in sand to produce HDPE-concrete, which is compared against a control mix with 0% replacement. Optimal replacement percentages have been identified in the literature, and 64 specimens were prepared and tested to determine the concrete's behavior, including its strength and flexural performance, to validate the advantages and disadvantages of each replacement in the search for the optimal configuration of sustainable concrete. Results showed that 5% and 7.5% replacement levels achieved optimal compressive (409 kg/cm²) and flexural (49 kg/cm²) strengths, respectively. Although these mixes exhibit slower strength gain reaching peak values at 28 days, lower replacement rates showed superior 7-day strength. Conversely, higher replacement levels increased recycling volume, reduced unit weight and slump, and raised air content without compromising the paste-aggregate bond. The findings suggest that HDPE-concrete is a promising solution for the construction industry, as it not only promotes the circular economy of plastic waste but also offers adequate mechanical performance, making it a viable and eco-friendly alternative for building material production.
Highlights
- The incorporation of high-density polyethylene into concrete mixes is an environmentally responsible practice whose performance has been actively researched since 2020, demonstrating significant benefits at low replacement percentages.
- Replacement percentages as a fine aggregate of 5% and 7.5% offer the best performance in compressive and flexural strength, respectively.
Nomenclature
HDPE: High-Density Polyethylene
Keywords
Content
1 Introduction
Concrete is the most widely used material for construction due to its advantages, including strength, durability, and economy. Its global demand amounts to 2.5 billion tons annually [1]. As a result, efforts must be made to reduce its carbon footprint [2]. The incorporation of plastic waste into concrete mixes is a sustainable alternative that helps reduce plastic waste in landfills and the use of natural aggregates [3]. Concrete is typically classified according to its compressive strength in kg/cm² (greater than 250 kg/cm² indicates structural applications). This classification is particularly relevant for rigid pavements, which are designed using flexural strength or Modulus of Rupture (MR) as an indicator, with values ranging between 36-50 kg/cm².
On the other hand, plastics are carbon-based polymers composed of long-chain molecules that maintain their structure through chemical bonds [4]. These revolutionized the industry in the early 20th century, and after the discovery of Bakelite, an artificial polymer, various high-performance polymers were developed for applications such as packaging, the automotive industry, electronics, and construction. In most cases, they are only used once and then discarded, with low recycling rates. It is worth noting that their production annually accounts for 4% of the world's oil production [5], which increases the cost of producing new plastics, making recycling them a vital process.
Plastics are classified according to their thermal properties, each with an identification code in accordance with the Society of Plastic Industries. Plastic has brought benefits in various consumer products, but it ultimately becomes waste that affects the environment, with a decomposition period of mostly 500 years [6, 7]. For example, Polyethylene Terephthalate (PET), Polyvinyl Chloride (PVC), and Polystyrene (PS) take approximately 500 years to degrade. High-Density Polyethylene (HDPE) and Low-Density Polyethylene (LDPE) take around 150 years, while Polypropylene (PP) takes approximately 400 years. It is worth noting that during the decomposition of plastics, sulfur oxides (SOx), nitrogen oxides (NOx), and volatile organic compounds (VOCs) are released [8]. Additionally, during the production and recycling stages of plastics, energy is used, and emissions are generated into the atmosphere, which vary depending on the processing temperature—for example, PS requires a temperature of 70°C, HDPE requires 130°C, and PET requires temperatures of up to 260°C.
Global plastic production has followed an exponential growth trajectory, increasing by a factor of 20 over the past 50 years. It is estimated that plastic waste generation reaches 24.14 million tons annually, with this figure rising each year [9]. Plastic production reached 400.3 million tons in 2022, representing a 2.5% increase from the previous year. According to reports by [10], Asia accounts for 54% of global production, followed by North America with 17% and Europe with 14%. The remaining percentage is distributed across other regions. Notably, Europe has one of the highest demands for plastics, close to 40% [11]. In cities of developing countries, such as Mexico, plastics account for 6% to 9% of household solid waste [12, 13], corresponding to per capita generation rates of 1.2 kg per person per day, with only about 3% being recycled [14]. According to Roland Geyer et al. [15], of the total amount of plastics worldwide that are not currently in use, only 9% are recycled, 12% are incinerated, and 79% accumulate in landfills or are disposed of in the natural environment. It is concerning that, according to the latest estimate, more than 20 billion tons of microplastics are present in the ocean [11]. This data encourages taking action in this regard to increase recycling. Among the types of plastic recycling are mechanical and chemical recycling to produce new plastics, as well as those used for energy production. Lastly, there are those intended for incorporating plastics into concrete mixes as aggregate or fiber additive, considered low-carbon materials [16, 7]. This undoubtedly impacts the life cycle of plastics, preventing them from remaining in the environment during their degradation period.
Polyethylene Terephthalate (PET) is the most widely produced plastic and the one that causes the most environmental pollution. It is a semi-crystalline polymer with a density ranging from 1.33 to 1.38 g/cm³, with high mechanical strength and toughness [17]. Its widespread use as a beverage container allows it to be classified among high-quality thermoplastics. According to [5], PET production increased from 119,000 to 19,600,000 tons over a period of approximately 60 years (1950 - 2011).
HDPE is a synthetic thermoplastic polymer belonging to the Polyethylene (PE) family, formed by hydrocarbon chains, with a density ranging from 0.94-0.96 g/cm³, ductile, resistant to permeability, and with greater rigidity than other polymers, reaching between 204–459 kg/cm² [18]. It ranks third in global production with 13%, and is used in the manufacturing of pipes, milk containers, detergent bottles, cups, and boxes [9, 19, 10].
Authors such as [20, 21] state that their incorporation into concrete, even for structural elements, shows good performance. In this regard, this research focuses its evaluation on the incorporation of HDPE into concrete and the percentages that have the best overall behavior.
The literature has reported that replacement percentages of HDPE as low as 10% deliver the best performance, particularly as a fine aggregate. However, some authors state that, depending on the shape of the aggregate, acceptable results can be obtained with up to 30% replacement. These additions to concrete enable the development of lightweight elements that are resistant to weather exposure, waterproof, and provide thermal insulation [22, 23, 24]. Most studies analyze the use of PET, with only a small fraction verifying the performance of HDPE in concrete mixes. Since 2020, studies on the performance and impact of concretes incorporating HDPE in their mixes have gained relevance, increasing the number of such studies. These aspects consider strength prediction, mix optimization for reducing the carbon footprint, and improving concrete properties through variations in replacement percentages and combinations of additives.
In this regard, [7] examined the incorporation of HDPE into concrete based on the total amount of cement in the mix, considering replacement percentages of 2.5%, 5%, 10%, and 20% for laminar plastic particles measuring 5×20mm. They found that higher replacement levels result in decreases in slump and unit weight, as well as gains in tensile and compressive strength at a 5% replacement level. Despite this, the authors suggest non-structural applications. [21] agree that at low replacement percentages of HDPE, these properties improve (up to 1.25% in their case). [25] validated the performance of concrete with acceptable aggregate replacements ranging from 5% to 30%, confirming that at 5%, there is no impact on flexural or tensile strength.
Authors such as [26, 27, 28] assert that, except for air content, there are only decreases in any of the concrete properties from 15% onward. In addition, increases in compressive strength are documented for concrete containing 5%, 15%, and 20% of granulated HDPE passing through sieve No. 4; this addition helps mitigate the adverse effects of sulfate attacks on the concrete.
[29] indicate that the optimal mixture is 30% HDPE + 20% silica fume + 0.75% synthetic macrofibers + 1% steel fibers. This combination achieves the best balance between mechanical performance, economic viability, and environmental sustainability. Similarly, [24] found that replacing 5% of HDPE by volume as fiber maintains compressive strength. [30] conclude that the best combination is the substitution of 10% of natural coarse aggregate with recycled HDPE, because it maintains acceptable mechanical strengths and improves resistance to absorption and durability against sulfate attack. Beyond 20%, the reduction in strength becomes significant. [31] They claim that 10% HDPE in pellet form is the optimal replacement percentage because it offers a better balance between mechanical strength, durability, and sustainability. Above 30%, it is not recommended for structural concrete because it decreases mechanical strength. It is worth noting that HDPE increases resistance to chlorides and produces less shrinkage. In the case of [32], although they tested volumes ranging from 2.5% to 10%, they found that a 5% volume replacement of HDPE in the form of 10mm cubes is the optimal configuration. This substitution was tested in a concrete mix ratio of 1:1:2 with a water-cement ratio of 0.5, resulting in an increase in compressive strength of 20.23%, an increase in flexural strength of 3.78%, a reduction in tensile strength of 2.72%, and a 2.97% decrease in concrete density.
[33] found that among 10%, 20%, and 30% replacement of gravel with HDPE, 10% offers the best overall performance. The 30% replacement barely reaches 20 MPa in compressive strength. [34] reported that the tensile strength decreases by 24% with a 20% volume replacement. In comparison, the bending strength of concrete with 20% plastics in the form of 5mm pellets is significantly higher than that of traditional concrete.
[35] report that for a 30% replacement of powdered HDPE, the concrete density decreases by up to 13%. It also states that HDPE-concrete, compared to traditional concrete, shows an impact on thermal properties: Thermal conductivity decreases by 33.91%, Specific heat decreases by 25.45%, and Thermal diffusivity decreases by 16.13%. [36] indicate that a 25% substitution in the volume of coarse aggregate has an environmental performance in terms of CO2 emissions comparable to concrete made with natural aggregates and does not show a decrease in compressive strength. [37] found that the partial replacement of 30% of the coarse aggregate has a favorable environmental impact and maintains a load capacity and ductility very similar to the control mixture. Additionally, the total toughness increases by more than 20%, which improves the post-failure structural behavior. [38] state that replacing 10% of sand with HDPE produces the best performance in compression and flexural strength; they also report the range of 10–15% as favorable for coarse aggregate. In this sense, [73] they demonstrated that low replacement percentages, particularly in the range of 5 % to 7.5 %, allow the mechanical strength of the concrete to be preserved, while reducing its density and increasing its ductility, mentioning that greater increases in HDPE lead to significant reductions in strength, mainly associated with the weak interaction in the interfacial transition zone between the polymer and the cementitious matrix.
On the other hand, replacing 10%, 20%, and 30% of gravel with HDPE results in decreases in strength of 2.3%, 7.8%, and 13.6%, respectively. Replacements starting from 40% are no longer convenient. It is worth noting that, although the strength decreases, it remains between 30 MPa and 35 MPa, which meets the minimum of 20 MPa established by regulations [39]. In this regard, [40] indicates that low replacement percentages in granular form show adequate performance in compression and bending even in seismic zones. [41] state that considering 50% replacement results in reductions in average compressive and flexural strength of 26% and 53%, respectively. [42] indicate that the decrease in strength is dramatic after 10% replacement of plastic with sand. On the other hand, a 10% replacement of sand with HDPE results in a decrease in compressive strength ranging from 12.5% to 15.1% [43]. Recognizing this behavior enables the redesign of the target strength, taking into account the expected reduction in strength. The same author notes that replacing 10% of plastic could save 820 million tons of natural sand annually, which is significant given the non-renewable resources involved. [44] mentions that using these plastics as polymer modifiers in asphalt reduces permanent deformation and cracking. Diversifying the use of plastics in construction enables a more effective utilization of plastic waste. In this sense, [74] they evaluated blocks made of oil-fused plastic sheets, reporting compressive strengths for non-structural applications, but which due to their plastic nature had very low absorption and porosity. [45] analyzed the performance of blocks with 20-35% HDPE, which had lower density and better resistance at 30% sand replacement. [46] Note that with a maximum of 50% HDPE replacement, the compressive strength decreases by 18%, while the flexural strength drops by up to 50%. In contrast, concrete becomes lighter, and its thermal resistance improves, which has the potential for energy savings.
The above indicates that there is no single optimal percentage; it will depend on various factors such as the specific concrete element being analyzed, the type of strength used as the target indicator (compressive strength, tensile strength, flexural strength, shear strength, elastic modulus, density, among others), as well as the cement consumption used.
This work aims to provide a framework derived from experimental data and prior research to define the specific thresholds at which HDPE aggregate replacement matches or exceeds the performance of traditional concrete. In doing so, it addresses the feasibility and reliability of HDPE-recycled concrete for structural applications. The environmental and economic benefits of utilizing HDPE-concrete in paving and complementary infrastructure will be quantified in a forthcoming article.
2 Materials and methods
To carry out the impact assessment of concrete with HDPE plastic substitutions, the stages shown in Fig. 1 were followed. The first was outlined in the introduction, and the last in the conclusion section. The remaining stages are described below.

Fig. 1. Diagram of the current research stages. Own elaboration
Based on the literature review, the replacement percentages to be used in this research were defined as 0% (control mix or no replacement), 2.5%, 5%, 7.5%, 10%, 15%, 20%, and 30%. The selected range spans from 0% to 30%, as most similar studies use maximum percentages of 20%. Changes are more sensitive at lower percentages; therefore, increments of 2.5% are studied from 0% to 10% replacement. Percentages up to 30% are explored to verify what some authors have indicated—that there are minimal effects on concrete performance, particularly in the hardened state.
2.1 Aggregates analysis
The concrete's resistance not only depends on the cement paste but also on the properties of the aggregates, which can vary depending on their geological nature [47, 48].
In this regard, after an analysis of available raw materials and seeking compliance with the desirable limits for specified parameters for aggregates in NMX-C-111-2018 [49], it is essential to note that several aggregates were analyzed before determining which ones would be used in the concrete mix (see Fig. 2). The aggregate analysis included the following: 37mm gravel, ¾” gravel, ¾” C gravel, ¾” I gravel, 10mm gravel, natural sand, and HDPE plastic. The aggregate analysis considered the following tests described in the Mexican Official Standards (NMX): Grain size distribution (NMX-C-077-2019 [50] and NMX-C-084-2018 [51]), Volumetric mass (NMX-C-073-2004 [52]), Moisture (NMX-C-166-2018 [53]), Density and Absorption (NMX-C-164-2014 [54] and NMX-C-165-2020 [55]), Resistance to abrasion or wear (NMX-C-196-2010 [56]). After verifying the properties of these aggregates, it was decided that the most suitable option was to use a combination of gravels, with GTMG37 as the main gravel, which is a crushed-granite mine gravel of 1 ½” (37mm), and GSMG10 as the secondary gravel, semi-crushed granite mine gravel of 3/8” (10mm), both from the GUSA Mexicali material bank. Regarding Natural Sand (NS), it comes from the CUCOS material bank in Mexicali. The HDPE plastic (10mm) comes from Universal Recycling Mexicali. For all materials, sampling and sample reduction procedures are implemented in accordance with current regulations. The following are the quality control tests for aggregates.
The 37 mm gravel has been selected due to its performance demonstrated in structural elements subjected to bending, such as industrial floors and rigid pavement slabs. These coarse aggregates help in the proper distribution of loads from the surface to the subsequent lower layers [57]. The combination of 37 mm and 10 mm gravels allows filling the voids caused by the lack of gradation sizes in the main gravel.
HDPE plastic is subject to the same regulations as concrete aggregates because it is used as a replacement. Its incorporation is feasible because it meets the granulometric limits at all sizes, with the 3/8” size being predominant. This material is produced by Universal Recycling Mexicali, which crushes it mechanically, and the shape of the particles is achieved by subjecting them to extrusion forces.
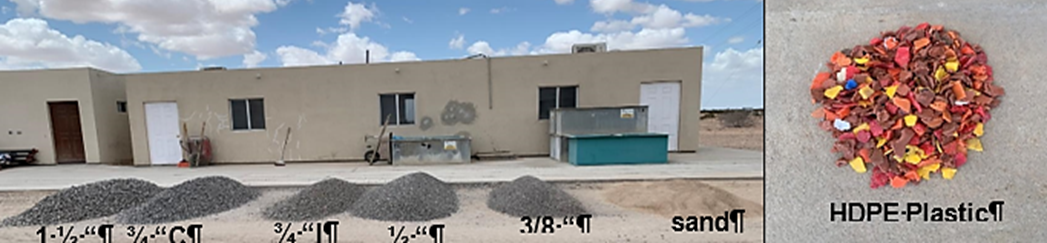
Fig. 2. Granulometric distribution of HDPE plastic. Own elaboration
2.2 Concrete mix design and gravel/sand ratio
In addition to the aggregates described in the previous section, Composite Portland Cement with a 40 strength class (CPC40) produced in Mexico was used, which complies with NMX-C-414-2017 [58]. The water used is potable, meeting the current NMX-C-122 [59]. Regarding the additives used, there are two: Sika Plastiment 550 (P550) and Sika Viscoflow 8100. The first allows for delaying the evaporation process of the water, acting as a water reducer, which is commonly added in hot climate zones. The second is a high-range water-reducing admixture that helps improve workability and the retention of the concrete mix's slump. It was chosen due to the potential water absorption of the material passing through the No. 4 mesh of the GSMG10.
Eight types of mixtures are defined based on the partial substitution of sand with HDPE plastic, corresponding to M1 (control mixture, with 0% replacement). The following seven mixtures include replacements: M2 (2.5%), M3 (5.0%), M4 (7.5%), M5 (10.0%), M6 (15.0%), M7 (20.0%), M8 (30.0%). These replacement percentages were selected based on references in the literature by authors such as [25, 7].
The mix design method is derived from the Guide for the Construction of Concrete Floors and Slabs, as outlined by the ACI 302R committee. The flexural strength or breaking modulus is set at 45 kg/cm² in accordance with the guidelines for pavement structure design using the AASHTO method for major urban roads. The water/cement ratio (w/c) is 0.50, recommended to ensure the durability of the concrete element at later ages beyond 28 days and throughout its service life up to a period of 25 years, as indicated in ACI 302.1R-04 [60].
The cement consumption is estimated based on Table 6.2 of ACI 302.1R04, defining the range between 280 to 330 kg/m³ when considering the maximum nominal size of aggregate as GTMG37 gravel, while when the maximum nominal size of aggregate refers to GSMG10 gravel, the range is from 360 to 415 kg/m³. With the above information, Equations 1 and 2 should be applied to determine both the minimum and maximum cementitious material content.
Where:
- CMCPMin = Minimum average cementing material content (kg/m³).
- CMCG1Min = Minimum cementing material content for gravel 1 (kg/m³).
- CMCG2Min = Minimum cementing material content for gravel 2 (kg/m³).
- n = Number of gravels
Where:
- CMCPMax = Average maximum cementitious material content (kg/m³).
- CMCG1Max = Maximum cementitious material content for gravel 1 (kg/m³).
- CMCG2Max = Maximum cementitious material content for gravel 2 (kg/m³).
- n = Number of gravels
On the other hand, the initial amount of water is determined using the indicated w/c ratio, and the cement consumption is calculated by applying Equation 3. The resulting value of the water amount is a base value that depends on a moisture and absorption correction procedure, based on the characteristics of the concrete aggregates.
Where:
- CA = Amount of water required (kg/m3).
- w/c = water/cement ratio (dimensionless).
- CC = Cement consumption (kg/m3).
The gravel/sand ratio (g/s) is an essential parameter obtained through the correction or adjustment program of ACI 302, where the previously estimated and calculated design parameters are introduced and reviewed, along with the parameters from the analysis of the selected gravel and sand aggregates for the concrete mix design. The gravel/sand ratio (g/s) is a dimensionless value that represents the percentage of gravel and sand that the concrete mix to be designed will contain, as determined by the correction and adjustment program.
The first step is to input the design parameters that have already been obtained into the program, which is designed in a Microsoft Excel spreadsheet based on the design of normal mass concretes according to the mass and absolute volume method, as described by the ACI 211.1-22 committee [61]. An important aspect to note regarding the g/s ratio is that it must be proposed to determine the quantities of aggregates required and to proceed with the mixture adjustment.
Next, it is necessary to use the charts provided by ACI 302.1R-04 [60] to identify the distribution of aggregates and the corresponding thickness factor (Type I to Type V) in relation to the workability factor. In this way, the concrete mix design determines the base dosage, and through the correction for moisture and absorption indicated, the final dosage of each mix ingredient is obtained.
2.3 Tests on hydraulic concrete
To verify and validate the quality control of concrete, the procedures outlined in the Mexican standards, presented in Table 1, are used for both fresh and hardened concrete. According to the experimental design, a total of 64 specimens were established to analyze the performance of compressive and flexural strength.
Table 1. Tests on fresh and hardened concrete. Own elaboration
|
|
Tests |
Applicable regulations in Mexico |
|
Fresh concrete |
Preparation and curing of concrete specimens |
NMX-C-159-ONNCCE-2016 [62] |
|
Concrete temperature |
NMX-C-435-ONNCCE-2010 [63] |
|
|
Concrete slump |
NMX-C-156-ONNCCE-2010 [64] |
|
|
Unit mass of concrete |
NMX-C-162-ONNCCE-2014 [65] |
|
|
Air content of concrete |
NMX-C-157-ONNCCE-2006 [66] |
|
|
Concrete in a hardened state |
Compressive strength |
NMX-C-083-ONNCCE-2014 [67] |
|
Flexural strength |
NMX-C-303-ONNCCE-2010 [68] |
2.4 Statistical analysis of results
To evaluate the impact of HDPE as a partial replacement for fine aggregate on the mechanical properties of concrete, a statistical analysis was conducted on the results obtained from compression and flexural strength tests at 28 days of curing. Mixtures were prepared with eight levels of partial sand replacement by HDPE: 0%, 2.5%, 5%, 7.5%, 10%, 15%, 20%, and 30%. For each percentage, six specimens were fabricated and tested: three cylinders (for compression) and three prism beams (for flexion), following the procedures established by current technical standards for the mechanical characterization of hardened concrete.
Since the goal was to determine whether there were statistically significant differences in the mechanical properties based on the percentage of HDPE used, a one-way analysis of variance (ANOVA) was employed as an inferential tool, this analysis enables the simultaneous comparison of more than two groups (in this case, different substitution percentages) to determine whether the observed mean differences originate from the same population or if at least one of the groups exhibits a distinct behavior compared to the others.
The use of ANOVA is preferable to performing multiple independent Student's t-tests, as it prevents inflating the Type I error (the risk of obtaining false positives). However, ANOVA only indicates the existence of a general difference but does not specify which particular groups this difference occurs between. Therefore, it is complemented with a post-hoc Tukey HSD (Honestly Significant Difference) test, which makes pairwise comparisons between groups and adjusts the significance level for each comparison, maintaining overall error control.
The choice of the Tukey test is appropriate when groups are of equal or similar size; it allows for identifying which pairs of mixtures show significant differences and provides additional information, such as the adjusted p-value, the mean difference, and the confidence intervals for each comparison.
This combined approach (ANOVA + Tukey) provides a comprehensive view of the statistical behavior of the data, allowing for more rigorous support of the study's conclusions. The one-factor analysis of variance is based on equation 4 for the F statistic:ístico F:
Where:
- $S_B^2$ = Variance between the groups (Variation explained by the treatment).
- $S_W^2$ = Variance within the groups (Variation due to random error).
These variances are calculated using equation 5, Variance between groups (Treatments), and Variance within groups (error), equation 6:
Where:
- k = number of groups or levels of substitution. sustitución.
- $n_i$ = Number of samples per group.
- $\bar{x}_i$ = Mean of group i.
- $\bar{x}$ = Average media of all groups.
- N = Total number of observations
The value of the F statistic is compared with a Fisher-Snedecor F distribution table with k-1 and N-k degrees of freedom to obtain the associated p-value. Once the existence of significant differences is confirmed (p-value < 0.05), the Tukey HSD test was applied, whose formula for calculating the minimum significant difference is:ativa es:
Where:
- $q_{\alpha}(k, N-k)$ = Critical value of the Studentized distribution (q distribution).
- $MSE$ = Mean square error obtained from ANOVA.
- $n$ = Number of observations per group (assuming equal sizes).
- $k$ = Group numbers.
- $N$ = Total number of data.
When the absolute difference between the means of two groups exceeds the HSD value, it is considered that there is a significant difference between those two treatments.
3 Results and discussion
3.1 Aggregate analysis
NMX-C-111 [49] specifies the properties and testing methods to be applied for aggregate analysis. The following subsections report the results obtained from these tests.
3.1.1 Granulometry
The grain size analysis is performed in accordance with the NMX-C-077 standard. It should be noted that after this analysis, not all aggregate sizes were used for the concrete mixes with HDPE; the selection of aggregates depends on the characteristics determined in the laboratory. Figure 3 shows the grain size curve of the sand and the HDPE plastic, which was tested considering the same upper and lower limits as the fine aggregate. It also presents the adjustment level for 37 mm (1 ½”) gravel and 10 mm (3/8”) gravel under the designations GTMG37 and GSMG10, respectively. It is essential to note that this combination of gravels enables compliance with the granulometric limits specified in the NMX-C-111 standard [49], while also reducing voids for improved material packing. When applying the grain size analysis to natural sand (NS), it was identified that it has a low fineness modulus, which anticipates a higher water content in concrete mix designs. The addition of HDPE plastic in cases of NS substitution improves the grain size curve of the fine aggregate by substitution, allowing it to meet the percentage distribution of each size within the lower (% minimum) and upper (% maximum) granulometric limits.
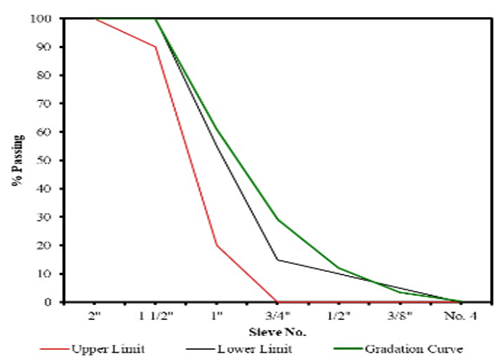
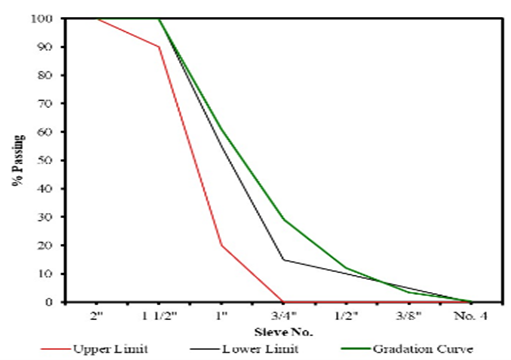
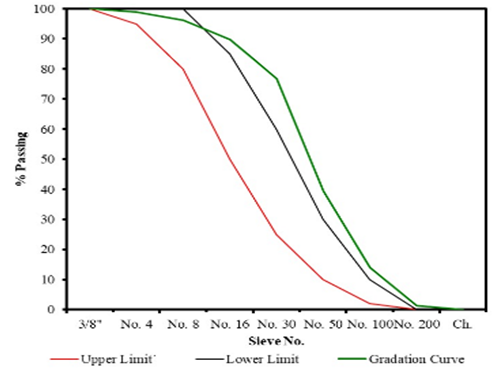
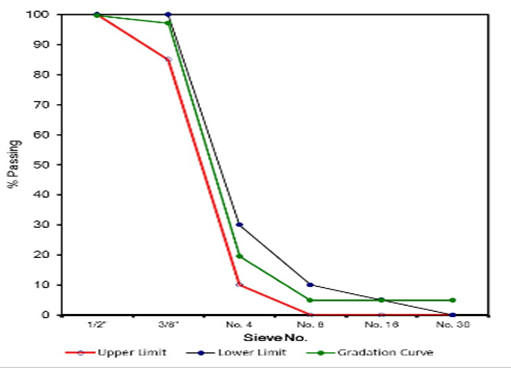
Fig. 3. Granulometric distribution of HDPE plastic. Own elaboration
3.1.2 Various characteristics of aggregates
The relative density, defined as the ratio of the density of the saturated and surface-dried aggregate to the density of water, has values for normal-weight rock aggregates ranging from 2.4 to 2.9. According to [69], the relative density of HDPE plastic ranges from 0.94 to 0.97; for the NS-HDPE combination, there is no regulatory reference. Some procedures for determining the relative density, moisture, absorption, and bulk density of materials are shown in Fig. 4. These properties are required for dosage calculations of ingredients in concrete mixes. Table 2 shows the results of these tests.
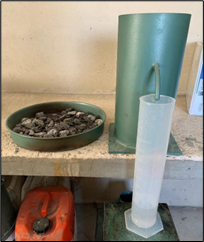
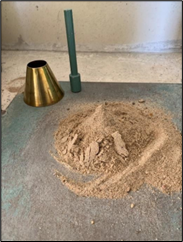
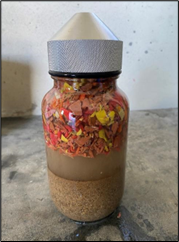
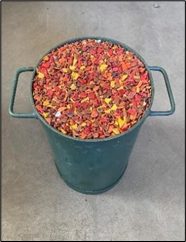
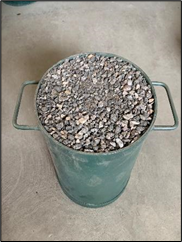
Fig. 4. Laboratory tests on aggregates for concrete. Own preparation
It is worth noting the flotation effect of HDPE plastic identified during the density test; this could be a limitation on the maximum percentage of plastic replacement with aggregates, as it may cause segregation in concrete mixes in large quantities. Therefore, plastic aggregates can influence the placement of concrete, acting like a spring when the concrete is compacted through vibration [70].
Table 2. Properties of aggregates used in concrete. Own elaboration
|
Materials |
Relative density |
Absorption (%) |
Humidity (%) |
Unit mass (kg/m3) |
|
GTMG37 |
2.710 |
0.349 |
0.13 |
1597 |
|
GSMG10 |
2.685 |
0.786 |
0.22 |
1580 |
|
Natural sand (NS) |
2.612 |
1.010 |
0.35 |
1760 |
|
HDPE plastic |
0.967 |
- |
- |
530 |
Absorption is determined according to NMX-C-165 and allows for better control of the total water required by the concrete. The results presented in Table 3 are close to the lower limit for gravel or sand at 0.2%. In the case of HDPE, they have little to no absorption [3, 25]. The bulk density meets the range for normal-weight aggregates between 1200 and 1750 kg/m³; it is essential to consider the impact of the granulometric curve trajectory of the aggregates, because it is very accurate what is noted by [38], that the amount of voids varies from about 30% to 45% for coarse aggregate and from 40% to 50% for fine aggregate. Incorporating plastic aggregates into concrete mixes undoubtedly reduces the nominal value of the concrete's bulk density, which increases with the percentage of replacement, but also results in an increase in the rate of air or voids, related to the adhesion between the paste and aggregates. Regarding the relative density of the fine aggregate (NS-HDPE), it is 1.816. Regarding abrasion resistance, NMX-C-196 permits a maximum wear of 50%, while the combined use of both gravels results in 38.20% wear. If HDPE plastic aggregate is considered as part of this test along with both gravels, a wear value of 22.41% is obtained because plastic has zero abrasion.
3.2 Concrete mix design and gravel/sand ratio
By substituting the variables into equations 1 and 2 (gravel 37 mm and gravel 10 mm), the following results are obtained.
\[\mathrm{CMC}_{\mathrm{Min}} = \frac{280 \, \mathrm{kg/m^3} + 360 \, \mathrm{kg/m^3}}{2} = 320 \, \mathrm{kg/m^3}\]
\[\mathrm{CMC}_{\mathrm{Max}} = \frac{330 \, \mathrm{kg/m^3} + 415 \, \mathrm{kg/m^3}}{2} = 372.5 \, \mathrm{kg/m^3}\]
The range of combined binder material content for the two different gravel sizes is between 320 and 372.5 kg/m3. For this case, a value at the upper limit will be used, setting the cement consumption for this design at 370 kg/m3. Subsequently, based on performance and exposure conditions, the amount of cement can be reduced.
The amount of water is obtained using the indicated w/c ratio and the cement consumption obtained, by substituting the values into equation 3:
\[CA = (0.50)(370 \, \mathrm{kg/m^3}) = 185 \, \mathrm{kg/m^3}\]
On the other hand, after a sensitivity analysis, the initial gravel/sand (g/s) ratio is 2.03, corresponding to a content of 67% gravel and 33% sand. The base dosage of each ingredient per cubic meter of concrete is presented in Table 3, with masses reported in a dry condition and under the Superficially Dry Saturated (SDS) condition.
Table 3. Basic dosage of concrete ingredients. Own elaboration
|
Mixture components |
Density (kg/m3) |
Mass dry (kg) |
Mass SDS (kg) |
|
Portland cement |
3050 |
370 |
370 |
|
GTMG37 |
2710 |
942 |
945.3 |
|
GSMG10 |
2685 |
311 |
313.4 |
|
Natural Sand |
2612 |
596 |
602 |
|
Water |
1000 |
185 |
173.2 |
|
Air |
2% |
|
|
|
Total |
|
2404.0 |
2404.0 |
Considering the values from the aggregate and ingredient analysis previously determined, the validation and correction of the mixture proportions in Table 4 were carried out using the graphs provided by ACI 302 [60]. Figure 5 illustrates the level of fit of the aggregates in this study's mixture (red line) to two dashed black lines representing the minimum and maximum limits. The overlapping lines highlight the impact of size distribution on this analysis and on the mixture design. The result demonstrates that, when combining the set of coarse aggregates, their arrangement and distribution leave certain voids because, with the proposed g/s ratio, the coarse aggregate is given a greater presence. To confirm the level of fit of the combined particle size distribution, a representation of the aggregates is carried out using the Power Chart (see Fig. 6). This chart describes how dense the combined particle size distribution can become, taking as a starting point that the dashed black line represents the optimal trajectory for a dense gradation and tends to accommodate the aggregates better, promoting the smallest possible number of voids.
The red line describes the behavior of the aggregates used for this research. It can be observed that the fine material exhibits a good particle distribution; however, as it progresses toward the coarse aggregates, there is a lack of material in some sieves, indicating that the GSMG10 and the sand create a compensatory effect for the lack of uniform particle distribution in the GTMG37.To conclude this section on revisions and adjustments of the aggregate proportions, the Thickness Factor chart (Fig. 7) is used, which provides a final analysis of the influence generated by the combination of coarse aggregates in the concrete mix design. Achieving an optimal position within the parameters of this chart indicates the expected overall performance, even if the aggregates have not fully met the 100% adjustment and uniform distribution expected in the previous two figures.
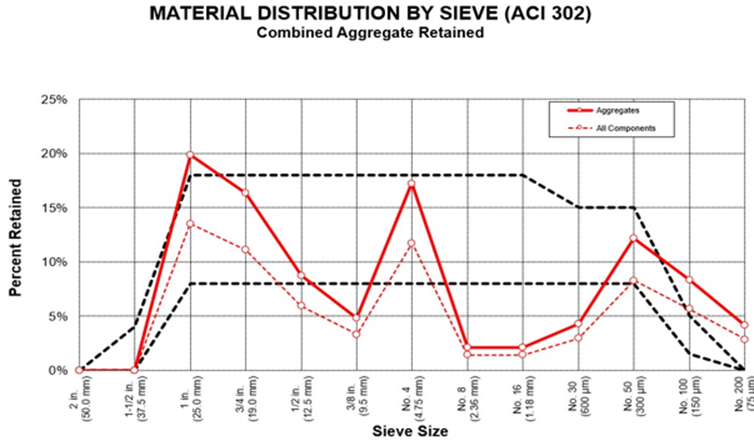
Fig. 5. Material distribution by mesh. Source: Prepared based on [60]
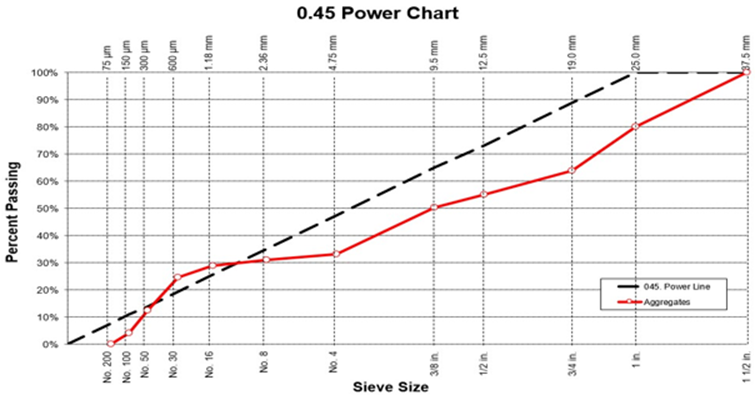
Fig. 6. Chart of aggregate strength for concrete. Source: Prepared based on [60]
It can be observed that the combined aggregates are located within Zone II (Optimal Zone or Shilstone Zone), indicating a well-graded aggregate mixture that allows for the production of high-quality concrete with good workability and a lower potential for shrinkage and segregation. This is ideal for a durable surface with an excellent finish. It should be noted that ACI 302 indicates that in Zone II, maximum nominal sizes range from 1½” to ¾”, which is the case for the mixture in this work, so it can be affirmed that its use is feasible. In this regard, despite the lack of distribution and granulometric density of the coarse aggregate noted in the previous two figures, supplementing the 37mm gravel with 10mm gravel helped the aggregate combination move in a straight line from Zone I to Zone II. Additionally, there is size compensation, such as 3/8”, derived from the granulometry of HDPE-sand. Therefore, being in Zone II suggests confidence in the concrete mixture's performance, which must be verified through concrete tests, as presented in the following section. The final proportions of the concrete mixture ingredients per cubic meter, taking into account adjustments for moisture and absorption, are presented in Table 4. Regarding the quantities for preparing specimens in the laboratory with a production volume of 75 liters, these are shown in Table 5, where it is clearly visible how the amount of natural sand decreases as the percentage of HDPE plastic replacement increases.
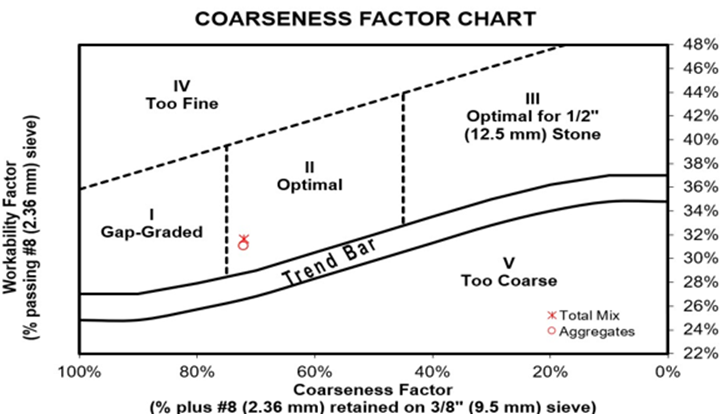
Fig. 7. Thickness factor chart. Source: Prepared based on [60]
Table 4. Final dosage of concrete ingredients per cubic meter. Own elaboration
|
Mixture components |
Mass SDS (kg/m3) |
|
Portland cement |
370.00 |
|
GTMG37 “ |
938.61 |
|
GSMG10 |
308.62 |
|
Natural Sand |
589.72 |
|
Water |
196.75 |
|
Total |
2404.0 |
Table 5. Final dosage of concrete ingredients for 75 liters. Own elaboration
|
Material (units) |
M1 (0%) |
M2 (2.5%) |
M3 (5%) |
M4 (7.5%) |
M5 (10%) |
M6 (15%) |
M7 (20%) |
M8 (30%) |
|
CPC40 (kg) |
27.75 |
27.75 |
27.75 |
27.75 |
27.75 |
27.75 |
27.75 |
27.75 |
|
Water (Lt) |
14.76 |
14.76 |
14.76 |
14.76 |
14.76 |
14.76 |
14.76 |
14.76 |
|
Natural Sand (kg) |
44.23 |
43.12 |
42.02 |
40.91 |
39.81 |
37.60 |
35.38 |
30.96 |
|
GTMG37 (kg) |
70.40 |
70.40 |
70.40 |
70.40 |
70.40 |
70.40 |
70.40 |
70.40 |
|
GSMG10 (kg) |
23.15 |
23.15 |
23.15 |
23.15 |
23.15 |
23.15 |
23.15 |
23.15 |
|
HDPE10 (kg) |
0 |
1.11 |
2.21 |
3.32 |
4.42 |
6.64 |
8.85 |
13.27 |
|
Sika P550 (ml) |
152.60 |
152.60 |
152.60 |
152.60 |
152.60 |
152.60 |
152.60 |
152.60 |
|
Sika Viscoflow (ml) |
27.80 |
27.80 |
27.80 |
27.80 |
27.80 |
27.80 |
27.80 |
27.80 |
3.3 Hydraulic concrete tests
3.3.1 Tests on fresh concrete
Table 6 shows the results of the fresh concrete tests. The average recorded temperature was 28°C; it is worth noting that the tests were conducted in September. Nevertheless, all of them meet the maximum temperature allowed by ACI 305 for Hot Climates, established at 35°C. The initial temperature is relevant because initial values at 32°C can result in a strength below 95%, as it accelerates cement hydration at an earlier stage, tending to establish weaker or more porous structures in the concrete paste [38]. The average slump value was 10 cm; this workability indicator of the mixes complies with the permitted parameters, which were designed for these mixes (10 ± 2 cm). The consistency is consistent with the w/c ratio of 0.50.
Table 6. Results of fresh concrete tests. Own elaboration
|
C |
Temperature (ºC) |
Concrete slump (cm) |
Unit mass of concrete (kg/m3) |
Relative performance |
Air content (%) |
|
M1 (0%) |
28.0 |
12 |
2380 |
1.01 |
1.7 |
|
M2 (2.5%) |
25.5 |
18 |
2390 |
1.01 |
1.8 |
|
M3 (5%) |
27.5 |
14 |
2353 |
1.02 |
2.3 |
|
M4 (7.5%) |
33.9 |
8 |
2303 |
1.04 |
2.5 |
|
M5 (10%) |
31.6 |
9 |
2256 |
1.07 |
2.7 |
|
M6 (15%) |
30.0 |
6 |
2216 |
1.08 |
3 |
|
M7 (20%) |
28.1 |
8 |
2191 |
1.10 |
1.9 |
|
M8 (30%) |
19.6 |
3 |
2112 |
1.14 |
2.6 |
The unit weight of the mixtures ranged from 2112 to 2390 kg/m³. Mixtures with less than 15% HDPE plastic replacement meet the standards established for normal-weight structural concrete, as specified in NMX-C-155. In contrast, mixtures with more than 15% replacement exhibit unit weights characteristic of lightweight concrete. Regarding relative performance, these fall within a range of 1.01 to 1.14, meeting the expected volume. The additional amount is due to the incorporation of HDPE plastic. It is worth noting that this also involves the creation of voids, allowing mixture designs to remain optimized. Additionally, the air content in the concrete mixtures ranges from 1.7% to 3%, complying with the air content recommended in ACI 211 for unair-entrained concrete with maximum nominal aggregate sizes of 10 mm and 40 mm, respectively. The results obtained for all the characteristics of the fresh concrete indicate that for replacement percentages of up to 10%, the integrity of the concrete is maintained in accordance with the specifications for fresh concrete.
3.3.2 Tests on concrete in the hardened state
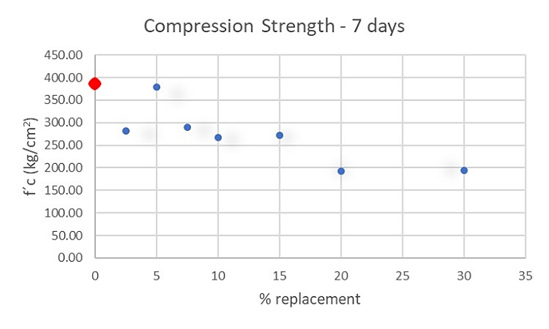
The compressive strength of the cylindrical specimens ranges from 221 to 409 kg/cm². In Fig. 8, it can be seen that the replacement percentage with the highest strength is 5%, with a strength of 409 kg/cm², surpassing the control mixture (0% replacement), which records an average strength of 405 kg/cm². As can be observed, after 15% replacement, the compressive strength gradually decreases. From 7 days of age, the 5% replacement exhibits the best performance, closely followed by the 2.5% replacement and the control mixture with 0% replacement, in that order. Therefore, it is confirmed that replacement percentages of 5% HDPE and lower are the best alternative to avoid compromising the concrete's compressive strength. It is important to highlight that increasing the HDPE content by 2.5%—that is, to 7.5% replacement—reduces the strength by nearly 20%. This may be due to the weak bond between the plastic and the cement matrix.
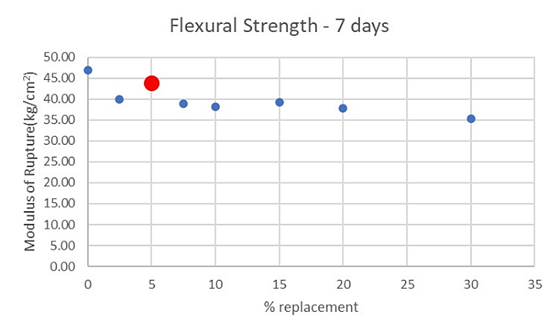
The flexural strength of the prismatic beams ranged from 40 to 49 kg/cm². All mixes fell within acceptable tolerances, with their specific performance across replacement percentages illustrated in Figure 9; notably, the 7.5% replacement level achieved the highest flexural strength. Regardless of the replacement level, all specimens failed within the middle third rather than at the supports. While mixes ranging from 0% to 10% experienced brittle rupture (Fig. 10b), the HDPE-modified beams with 15%, 20%, and 30% replacement did not reach complete failure. The ductility induced by the plastic content in these higher-percentage mixes leads to significant post-peak deflection during the service life. Particularly in floor slabs, this behavior could serve as an early warning mechanism prior to structural failure, providing a critical timeframe for building evacuation or structural retrofitting.
It is essential to note that the stresses generated in cylindrical specimens versus prismatic beams differ due to the load application area. In this regard, the optimal performance under compression was observed at 5% replacement. In contrast, the 7.5% HDPE mix proved optimal for maximizing flexural strength while maintaining mechanical integrity relative to the control. These results align with existing literature which note that HDPE replacements in the range of 5% to 7.5% allow the mechanical strength of concrete to be preserved [73, 21] which indicates that HDPE integration enhances tensile and flexural strength, improves crack control, and increases concrete ductility, with reported flexural strength increments ranging between 3% and 14%.
 |
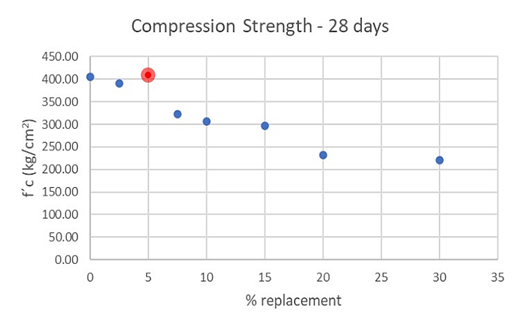 |
Fig. 8. Compressive strength at 7 and 28 days of age. Own elaboration
 |
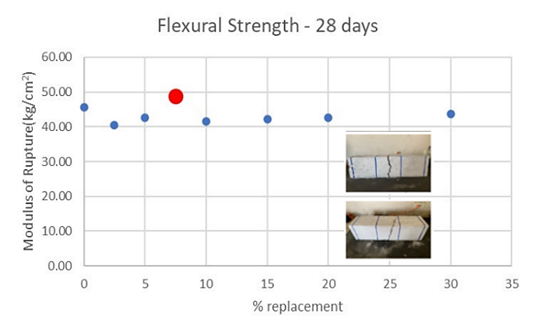 |
Fig. 9. Flexural strength at 7 and 28 days of age. Own elaboration
3.4 Statistical analysis of results
The results show that the mixture with 0% HDPE obtained the highest average compressive strength, with values significantly higher than those observed in most mixtures with HDPE. This difference was statistically validated using the F statistic equation (4), which yielded a value of 31.03. Based on the reference F distribution and applying equations (5) and (6), a p-value of 1.56 × 10^ (-10) was determined, which is well below the significance threshold of α = 0.05, indicating statistically significant differences between the groups. The Tukey HSD multiple comparison test was applied based on equation (7), using a constant number of samples per group (n = 4) and the MSE calculated from the ANOVA. The results confirmed that mixes with 7.5%, 10%, 15%, 20%, and 30% showed significantly lower strengths compared to the control mix (0%), as they exceeded the critical value of the minimum significant difference (HSD) and had adjusted p-values < 0.05. In contrast, the mix with 5% substitution did not show a statistically significant difference from the control, with an adjusted p-value of 0.372 and a confidence interval close to that of the 0% replacement. This result is relevant because it enables a preliminary technical recommendation for substitution that preserves the resistant properties of traditional concrete while also contributing to the valorization of plastic waste. The 5% percentage emerges as a technically feasible threshold, as it does not significantly compromise compressive strength.
In contrast, the flexural strength results showed a more homogeneous behavior among the different percentages of HDPE. The ANOVA analysis yielded an F-value of 2.16 and a p-value of 0.0755, which is higher than the adopted significance level of α = 0.05; therefore, the null hypothesis was not rejected. This result indicates that, overall, there are no statistically significant differences between the analyzed groups. The Tukey test was conducted to evaluate pairwise comparisons between mixes. Although none of the comparisons reached statistical significance, a notable trend was observed in the comparison between the 0% and 30% groups, with a mean difference of approximately -11.72 kg/cm² and a p-value of 0.066, just above the critical threshold. The remaining comparisons yielded values greater than 0.1, indicating that the differences are not statistically significant at the 95% confidence level. These results reinforce that the flexural strength of the concrete is less sensitive to the incorporation of HDPE than its compressive strength. This lower sensitivity could be related to the load transfer mechanisms in flexion, which are less affected by the presence of HDPE particles.
3.5 Microstructure analysis
This section presents the results of scanning electron microscopy analysis on one sample for each optimal replacement indicated for three points at 60x, 200x, and 1000x, which can be seen in Figure 10 for the sample with 5% replacement and in Figure 11 for the sample with 7.5% replacement.
Sample 5 (05% HDPE mix)
The microstructural SEM–EDS analysis of Sample 5 reveals an Interfacial Transition Zone (ITZ) characterized by an abrupt chemical discontinuity between the HDPE and the cement paste. This is confirmed by the elemental spectra, where point 001 shows 100% carbon corresponding to the plastic aggregate, in clear contrast to point 002 located in the cementitious matrix, which contains 38.06% calcium and 9.75% silicon associated with C–S–H gels and Ca(OH)2. Micrographs at different magnifications (60×, 200× and 1000×) show a relatively dense ITZ with generally continuous contact and without long, open cracks; the matrix partially wraps the HDPE, although localized smooth surfaces are observed where the polymer separates from the paste due to its hydrophobic nature and low surface energy, which hinder deep mechanical interlocking. This morphological and chemical configuration of the ITZ acts as a structural weak zone that limits effective load transfer between phases; however, the absence of large capillary pores and the moderate degree of debonding suggest a mechanically acceptable interface, consistent with mixes with low plastic content that retain adequate compressive strength and flexural performance while simultaneously reducing the density of the composite.
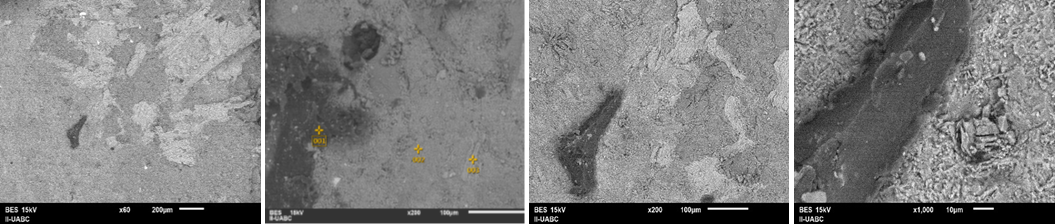
Fig. 10. SEM–EDS analysis of Sample 5. Source:Instituto de Ingeniería UABC
Sample 7 (7.5% HDPE mix)
In Sample 7, the SEM–EDS analysis highlights the impact of a higher replacement level on the microstructural integrity of the composite. The elemental spectra clearly distinguish the HDPE particle with 100% carbon (point 001) from interfacial regions with high silicon (33.48% at point 003) and calcium contents (35.20% at point 002), indicating the presence of hydrated silicates and possible fine aggregates in direct contact but not effectively bonded to the polymer. The micrographs reveal a more heterogeneous microstructure, with extensive HDPE regions surrounded by a less compact paste, the presence of perimeter microcracks, and interconnected porosity within the ITZ; at low magnifications, dark areas associated with voids or debonded zones are evident, while at 1000× a sharper interface is observed, with limited penetration of hydration products into the HDPE surface. In line with the findings reported by Akçaözoğlu et al. [71] and Belmokaddem et al. [72], this ITZ behaves as the “weakest link” of the system: the mismatch between the deformable HDPE and the rigid cement matrix promotes stress concentration and preferential crack paths, which explains the reduction in mechanical strength, the drop in ultrasonic pulse velocity due to wave attenuation in the interfacial porosity, and a premature mechanical failure governed by debonding at this smooth surface, favoring thermal insulation properties over structural performance.

Fig. 11. SEM–EDS analysis of Sample 7. Source:Instituto de Ingeniería UABC
4 Conclusions
It is essential to consider the characteristics of the concrete mixture in relation to the properties of the materials.
For example, the shape of the HDPE particle (square) influences tension and bending stresses, creating more voids; if it were more layered, it would fit better. As the replacement of HDPE increases, the unit weight decreases, the air content increases, the workability of the mixture decreases, ductility increases, and cracking due to concrete shrinkage decreases. It also increases its thermal resistance, decreases permeability, helps reduce chloride or sulfate attack, and enhances durability. It is essential to define the target properties to be promoted or improved in the concrete according to the applications and exposure conditions to which the concrete will be subjected, because this will justify the choice of the considered optimal replacement percentage and aspects such as additional ingredients or overdesign of the mixture based on the expected reduction in strength.
The results obtained indicate the performance of HDPE-concrete in both fresh and hardened states. It was found that replacements (low) of 2.5%, 5%, 7.5%, and 10% exhibit good behavior in the fresh state, while higher percentages, although they lighten the concrete, decrease its workability. Additionally, they impact the cohesion and adhesion with the concrete paste. This directly affects the properties of the concrete in the hardened state. The replacement percentages that proved to be suitable were 5% and 7.5% for compressive and flexural strength, respectively. The inclusion of HDPE in concrete at a level of less than 10% increases the ductility of the concrete. It yields a breaking modulus of 45 kg/cm², comparable to that obtained with a mix without replacement, but with the added benefit that replacing material addresses an environmental issue related to waste management.
The mixture with a 5% substitution for compressive strength did not show a statistically significant difference compared to the control mixture, with an adjusted p-value of 0.372, which was the case with higher replacement percentages. In contrast, regarding flexural strength, it exhibits a statistically more homogeneous behavior among the different HDPE replacements.
It was identified that the incorporation of HDPE into the concrete reduces abrasion in the hardened state. Still, in the fresh state of the concrete, a careful vibrating process is required to prevent HDPE from floating due to its density.
Within the limitations of this study are the economic constraints that prevented the preparation of more concrete specimens for additional statistical analyses, as well as the lack of microscopic equipment to identify the existing relationships between aggregates and paste in the interfacial transition zone. This is considered for future research, along with the assessment of the sustainable benefits of using these mixes with HDPE in concrete elements within a case study.
Acknowledgements
No funding was received. Kaleb Concrete provided the HDPE concrete materials. Benjamin Valdez Salas, PhD. From Instituto de Ingeniería UABC support for graduate students in conducting SEM–EDS analysis tests.
References
- Fuentes, N., Jiménez, K., Otero Añez, R., & Uzuriaga Wilfrido. (2021). Aprovechamiento sostenible de residuos poliméricos como agregados del concreto: una revisión. Interciencia, 46(6), 240–247.
- Wang, X., Yu, R., Shui, Z., Song, Q., & Zhang, Z. (2017). Mix design and characteristics evaluation of an eco-friendly ultra-high performance concrete incorporating recycled coral based materials. Journal of Cleaner Production, 165, 70–80. https://doi.org/10.1016/j.jclepro.2017.07.096
- Abeysinghe, S., Gunasekara, C., Bandara, C., Nguyen, K., Dissanayake, R., & Mendis, P. (2021). Engineering performance of concrete incorporated with recycled high-density polyethylene (HDPE): A systematic review. Polymers, 13(11), 1885. https://doi.org/10.3390/polym13111885
- Góngora, J. (2014). La industria del plástico en México y el mundo. Comercio Exterior, 64(5).
- Correia, J. R., Lima, J. S., & de Brito, J. (2014). Post-fire mechanical performance of concrete made with selected plastic waste aggregates. Cement and Concrete Composites, 53, 187–199. https://doi.org/10.1016/j.cemconcomp.2014.07.004
- LeBlanc, R. (2015). How long does it take garbage to decompose. Richland Center. http://storage.neic.org/event/docs/1129/how_long_does_it_take_garbage_to_decompose.pdf
- Tamrin, & Nurdiana, J. (2021). The effect of recycled HDPE plastic additions on concrete performance. Recycling, 6(1), 18. https://doi.org/10.3390/recycling6010018
- Siddique, R. (2008). Waste materials and by-products in concrete. Springer. https://doi.org/10.1007/978-3-540-74294-4
- Napper, I. E., & Thompson, R. C. (2020). Plastic debris in the marine environment: History and future challenges. Global Challenges, 4(6), 1900081. https://doi.org/10.1002/gch2.201900081
- PlasticsEurope. (2023). An analysis of European plastics production, demand and waste data. https://plasticseurope.org/knowledge-hub/plastics-the-fast-facts-2023/
- Greenpeace. (2025). Datos sobre la producción de plásticos. https://es.greenpeace.org/es/trabajamos-en/consumismo/plasticos/datos-sobre-la-produccion-de-plasticos/
- Ojeda-Benitez, S., Armijo De Vega, C., & Ramírez-Barreto, M. E. (2003). Characterization and quantification of household solid wastes in a Mexican city. Resources, Conservation and Recycling, 39(3), 211–222. https://doi.org/10.1016/S0921-3449(03)00028-4
- Buenrostro, O., Bocco, G., & Bernache, G. (2001). Urban solid waste generation and disposal in Mexico: A case study. Waste Management & Research, 19(2), 169–176. https://doi.org/10.1177/0734242X0101900208
- Santillán, M. L. (2018). Una vida de plástico. Ciencia UNAM. http://ciencia.unam.mx/leer/766/una-vida-de-plastico
- Geyer, R., Jambeck, J. R., & Law, K. L. (2017). Production, use, and fate of all plastics ever made. Science Advances, 3(7), 19–24. https://doi.org/10.1126/sciadv.1700782
- Soriano Ruelas, M. E., & Gutiérrez Moreno, J. M. (2022). Desempeño del concreto hidráulico con adición de residuos plásticos: Una alternativa de concreto sustentable. Aristas: Investigación Básica y Aplicada, 9(17).
- Islam, M. J., Meherier, M. S., & Islam, A. K. M. R. (2016). Effects of waste PET as coarse aggregate on the fresh and hardened properties of concrete. Construction and Building Materials, 125, 946–951. https://doi.org/10.1016/j.conbuildmat.2016.08.128
- Bahadur, P., & Sastry, N. V. (2005). Principles of polymer science. Alpha Science International.
- Patrício Silva, A. L., Prata, J. C., Walker, T. R., Campos, D., Duarte, A. C., Soares, A. M. V. M., Barceló, D., & Rocha-Santos, T. (2020). Rethinking and optimising plastic waste management under COVID-19 pandemic. Science of the Total Environment, 742, 140565. https://doi.org/10.1016/j.scitotenv.2020.140565
- Lopez, N., Collado, E., Diacos, L. A., & Morente, H. D. (2019). Evaluation of pervious concrete utilizing recycled HDPE. MATEC Web of Conferences, 258, 01018. https://doi.org/10.1051/matecconf/201925801018
- Pešić, N., Živanović, S., Garcia, R., & Papastergiou, P. (2016). Mechanical properties of concrete reinforced with recycled HDPE plastic fibres. Construction and Building Materials, 115, 362–370. https://doi.org/10.1016/j.conbuildmat.2016.04.050
- Hermida, É. (2011). Polímeros: Guía didáctica. Instituto Nacional de Educación Tecnológica.
- Bahij, S., Omary, S., Feugeas, F., & Faqiri, A. (2020). Fresh and hardened properties of concrete containing plastic waste: A review. Waste Management, 113, 157–175.
- Poonyakan, A., Rachakornkij, M., Wecharatana, M., & Smittakorn, W. (2018). Potential use of plastic wastes for low thermal conductivity concrete. Materials, 11(10), 1938. https://doi.org/10.3390/ma11101938
- Punitha, V., Sakthieswaran, N., & Babu, O. (2020). Experimental investigation of concrete incorporating HDPE plastic waste and metakaolin. Materials Today: Proceedings, 37, 1032–1035. https://doi.org/10.1016/j.matpr.2020.06.288
- Garg, A., & Biswas, S. (2020). Strength characteristics of concrete with e-waste and HDPE granules. Journal of Xi’an University of Architecture & Technology, 12(6), 90–108.
- Galupino, J., Adajar, M., Koa, N., Lao, A., Lao, R., Charles, J., & Tan, M. (2019). Response surface modelling of concrete mixed with fly ash and recycled HDPE. DLSU Research Congress.
- Shanmugapriya, M., & Santhi, H. (2017). Strength and chloride permeability of concrete with HDPE waste. International Journal of Chemical Sciences, 15(1).
- Abbas, S. N., Qureshi, M. I., Alkharisi, M. K., Alturki, M., & Ahmad, Z. (2024). Combined effect of silica fume and fibers in HDPE concrete. Construction and Building Materials, 445, 137940. https://doi.org/10.1016/j.conbuildmat.2024.137940
- Abbas, S. N., Qureshi, M. I., Abid, M., Tariq, M. A., & Ng, A. W. (2022). Mechanical properties of HDPE and e-waste concrete. Sustainability, 14, 4087. https://doi.org/10.3390/su14074087
- Aocharoen, Y., & Chotickai, P. (2023). Properties of concrete with PET and HDPE aggregates. Cleaner Engineering and Technology, 12, 100600. https://doi.org/10.1016/j.clet.2023.100600
- Romano, D. T. T., & Guades, E. J. (2024). Plastic coarse aggregates with HDPE and LDPE. E3S Web of Conferences, 488, 03005. https://doi.org/10.1051/e3sconf/202448803005
- Karthik, M., Ajey Kumar, V. G., & Keshava, M. (2021). Waste plastics in concrete mixes. IOP Conference Series: Earth and Environmental Science, 822, 012011. https://doi.org/10.1088/1755-1315/822/1/012011
- Mustafa, M. A. T., Hanafi, I., Mahmoud, R., & Tayeh, B. A. (2019). Plastic waste in concrete. Structures, 20, 519–526. https://doi.org/10.1016/j.istruc.2019.06.008
- Boussaq, C., et al. (2023). Thermophysical properties of HDPE concrete. JP Journal of Heat and Mass Transfer, 34, 139–151.
- Gravina, R. J., Xie, T., Bennett, B., & Visintin, P. (2021). Life-cycle assessment of HDPE/PET concrete. Journal of Building Engineering, 44, 103329. https://doi.org/10.1016/j.jobe.2021.103329
- Radhi, M. M., Khalil, W. I., & Shafeeq, S. (2022). Flexural behavior of HDPE concrete beams. Cogent Engineering, 9(1), 2127470. https://doi.org/10.1080/23311916.2022.2127470
- Kosmatka, S. H., Kerkhoff, B., Panarese, W., & Tanesi, J. (2004). Diseño y control de mezclas de concreto. IMCYC.
- Malkapur, S. M., Anand, A., Pandey, A. P., Ojha, A., Mani, N., & Mattur, N. C. (2014). Effect of mix parameters in plastic concrete. Journal of Structures, 1–8. https://doi.org/10.1155/2014/389014
- Majeed, A. Z., Kurian, T., Davis, B., Alex, S. T., Fernandez, K. S., & Mathew, A. V. (2019). Waste plastic in concrete blocks. https://doi.org/10.1007/978-981-13-1202-1_34
- Abbas, S. N., & Qureshi, M. I. (2025). Review of recycled aggregates in concrete. Next Research, 2(2), 100324. https://doi.org/10.1016/j.nexres.2025.100324
- Saxena, R., Siddique, S., Gupta, T., Sharma, R. K., & Chaudhary, S. (2018). Impact resistance of plastic concrete. Construction and Building Materials, 176, 415–421. https://doi.org/10.1016/j.conbuildmat.2018.05.019
- Thorneycroft, J., Orr, J., Savoikar, P., & Ball, R. J. (2018). Plastic waste in structural concrete. Construction and Building Materials, 161, 63–69. https://doi.org/10.1016/j.conbuildmat.2017.11.127
- Nguyen, M. T. (2024). Recycling polyethylene in asphalt concrete. In Reuse of Plastic Waste in Eco-Efficient Concrete, 407–425. https://doi.org/10.1016/B978-0-443-13798-3.00012-7
- Jassim, A. K. (2017). Plastic cement from polyethylene waste. Procedia Manufacturing, 8, 635–642. https://doi.org/10.1016/j.promfg.2017.02.081
- Al-Osta, M. A., et al. (2022). HDPE and crumb tire concrete. Journal of Building Engineering, 45, 103399. https://doi.org/10.1016/j.jobe.2021.103399
- De Brito, J., Kurda, R., & da Silva, P. R. (2018). Predicting concrete strength without aggregate properties. Applied Sciences, 8(7), 1095. https://doi.org/10.3390/app8071095
- Silva, R. V., de Brito, J., & Dhir, R. K. (2014). Recycled aggregates for concrete. Construction and Building Materials, 65, 201–217. https://doi.org/10.1016/j.conbuildmat.2014.04.117
- ONNCCE. (2018). NMX-C-111-ONNCCE-2018. México.
- ONNCCE. (2019). NMX-C-077-ONNCCE-2019.
- ONNCCE. (2018). NMX-C-084-ONNCCE-2018.
- ONNCCE. (2004). NMX-C-073-ONNCCE-2004.
- ONNCCE. (2018). NMX-C-166-2018.
- ONNCCE. (2014). NMX-C-164-2014.
- ONNCCE. (2020). NMX-C-165-2020.
- ONNCCE. (2010). NMX-C-196-2010.
- Umashankar, O., et al. (2022). Shape properties of aggregates. Materials Today: Proceedings, 60, 534–540.
- ONNCCE. (2017). NMX-C-414-ONNCCE.
- ONNCCE. (2019). NMX-C-122-ONNCCE-2019.
- ACI Committee. (2004). ACI 302.1R-04. American Concrete Institute.
- ACI Committee. (2022). ACI 211.1-22. American Concrete Institute.
- ONNCCE. (2016). NMX-C-159-2016.
- ONNCCE. (2010). NMX-C-435-2010.
- ONNCCE. (2010). NMX-C-156-2010.
- ONNCCE. (2014). NMX-C-162-2014.
- ONNCCE. (2006). NMX-C-157-2006.
- ONNCCE. (2014). NMX-C-083-2014.
- ONNCCE. (2010). NMX-C-303-2010.
- Calhoun, A., & Peacock, A. J. (2006). Polymer chemistry: Properties and applications. Hanser Gardner.
- Babafemi, A. J., Šavija, B., Paul, S. C., & Anggraini, V. (2018). Review of plastic concrete properties. Sustainability, 10(11), 3875.
- Akçaözoğlu, S., et al. (2013). Waste PET aggregates in concrete. Composites Part B, 45(1), 721–726.
- Belmokaddem, M., et al. (2020). Plastic waste in concrete properties. Construction and Building Materials, 257, 119559.
- Jamel, M. G., et al. (2023). Polyethylene waste in asphalt paving. Journal of Applied Engineering Science, 21(2), 428–439. https://doi.org/10.5937/jaes0-39960
- Thanaya, I. N. A., et al. (2024). Plastic blocks for construction materials. Journal of Applied Engineering Science, 22(4), 718–726. https://doi.org/10.5937/jaes0-50486
Conflict of Interest Statement
There are no interest conflicts to declare
Author Contributions
Data Availability Statement
It does not apply.