Volume 23 number 3 article 1290 pages 523-537
Received: Mar 30, 2025 Accepted: Jun 27, 2025 Available Online: Jul 28, 2025 Published: Sep 15, 2025
DOI: 10.5937/jaes0-57875
IMPROVING THE TRANSPORTATION IN BAGHDAD CITY CENTER
Abstract
This study applies GIS techniques and users’ responses to evaluate potential traffic and hotspot congestion, by synthesizing a composite index based on scores for traffic potential and road density. The study reveals that Sheikh Omar, King Ghazi, Al-Rasheed, and Haifa Streets, are the most congested roads at Baghdad center. Due to the concentration of bridges in this area, that link city’s sides the passing traffic forming a pressure on roads leading to these bridges. Lacking sufficient parking spaces, enforced the users to park their vehicles on the road sides, which affected negatively on roads capacity. In addition to mixed land use, interference from pedestrians, and absence of systematic public transit all that contributed in magnifying the congestion problem at city center of Baghdad city. To address these challenges, the study proposed three strategies of improvements, immediate (0-1year), intermediate (1-3 years), and long term (+3 years). The immediate improvements comprised providing organized parking lots, enhance pedestrian and cycling infrastructure, and managing freight movements. Developed a systematic public transit system in and around city center, and applying the smart traffic management systems proposed as intermediate improvements. The long-term improvements covered developing the roads network of Baghdad city, land use and urban planning adjustments.
Highlights
- GIS-based index identifies major congestion hotspots in Baghdad's city center.
- A novel composite index integrates traffic potential and road density for spatial congestion mapping.
- High congestion is linked to overcrowded bridges, curb parking, and mixed land use patterns.
- Step-by-step solutions suggested to mitigate congestion and enhance sustainable urban mobility.
Keywords
Content
1 Introduction
Urban mobility is a pressing global challenge, particularly in rapidly urbanizing regions where infrastructure struggles to keep pace with population growth. In Baghdad, the complexities of urban mobility are intensified by a unique set of socio-political, economic, and environmental factors that shape the city's transportation landscape.
Globally, urban mobility is becoming increasingly criticized for its ineffectiveness and negative environmental impact. Dominance and reliance on private cars have led to uncontrolled and unsustainable urban sprawl, contributing greatly to constant traffic congestion, air pollution, and social inequities [1]. Growth in the transportation sector is being decoupled from economic development in many cities by promoting sustainable modes such as cycling, walking, and other public transport [2]. In developing regions like Baghdad, the lack of infrastructure, regulatory barriers, and cultural attitudes toward transportation impede the country from transitioning to sustainable mobility [3].
In Baghdad, these global trends appear in distinct ways. There has been a remarkably rapid urban expansion in the city over the last few decades, primarily driven by economic growth necessitated by migration movements, delivering extensive land use transformation and higher urban heat [4, 5]. Since the transportation infrastructure was already under pressure from unplanned urbanization, it had an adverse impact on the environment, specifically, an increase in temperature and a decrease in air quality[5, 6]. Due to the lack of effective land-use planning, there has been a widespread proliferation of informal settlements, exacerbating mobility problems because such areas generally lack suitable access to public transport systems [7].
Environmental factors also increase the problems of urban mobility in Baghdad. Global warming trends, such as rising temperatures and the increasing frequency of extreme weather conditions, greatly affect the available transportation infrastructure and the conditions of the people [5, 6]. The high levels of urbanization in Baghdad make it susceptible to the urban heat island (UHI) effect due to high concrete coverage and relatively low vegetation cover that adds significantly to the difficulty of urban mobility since high temperatures reduce walking and cycling possibilities and increase dependency on motorized modes of transport [8, 9].
On the other hand, GIS and land use analysis present powerful tools that can be used to understand the complex interactions between environmental factors, mobility, and urban planning in addressing these challenges. In addition, these tools enable making decisions based on spatial data, further enriching the decision-making process in urban planning. GIS forms a foundation to visualize the complexity and multiple variable relationships between land use patterns and road transport systems in an urbanized landscape, which is a primary requirement to formulate practicable strategies to reduce road traffic congestion, improve road user safety, and promote sustainable urban development.
Many studies focus on the use of GIS in traffic and urban planning. For instance, Lopa, Hasrul [10] concluded that transportation and land use are integrated to form a single system where effective transportation infrastructure is significant for realizing land use potential. This aspect is supported by Tal, Theodory [11] who maintain that commercial dense and mixed land use regions attracted higher traffic volumes, providing evidence of integrating land use and transportation planning to alleviate traffic congestion. Similarly, Asmael, Al-Taweel [12] show that urban regions with high population density and mixed land use generate complex traffic, which needs comprehensive traffic evaluation and land use analysis.
GIS can also improve traffic management by understanding the traffic pattern and congestion. For example, Yap, Omar [13] studied commercial land use in Kuala Lumpur. They found that commercial land use is a major factor causing congestion, insights for forming evidence-based strategies to mitigate congestion. These studies emphasize the importance of incorporating GIS to analyze better and solve the complex factors surrounding urban transportation challenges.
Integration of land use and traffic analysis is a key component in successful urban planning. This has been evidenced by the work of Zhang, Liu [14], who proved that Urban traffic systems should be resilient to factors including land use change and environmental conditions. Such resilience is very important for the better suitability of transportation networks to cope with shifting patterns in the urban landscape. Furthermore, comparative analysis data from cities such as Toronto and Beijing demonstrates the significance of GIS and land use analysis in understanding traffic dynamics within various urban environments [15]. These studies show that good land use planning within the metropolitan area significantly reduces traffic density and enhances general mobility.
Although many studies have indicated the role of GIS and land use in urban transport studies, there are significant gaps in the literature, particularly with respect to cities such as Baghdad. The existing studies have limitations regarding data-driven traffic evaluation, which hinders the sustainable development of efficient transportation approaches. The limited availability of comprehensive traffic data and GIS in Baghdad limits the knowledge of the existing traffic dynamics and implementation of a city-specific approach. As highlighted by Asmael, Al-Taweel [12], there is a positive correlation between land use intensity and traffic congestion, but the absence of systematic data collection and analysis in Baghdad prevents the ability to apply these results locally.
Although GIS has proven to be a powerful tool for analyzing traffic patterns and informing urban policies in other cities, similar approaches have not been sufficiently considered in Baghdad. This gap provides an opportunity for the follow-up research to take up spatial data-driven methodologies and GIS-related technologies to improve city traffic assessment and urban spatial planning.
Therefore, this paper aims to assess urban mobility within a sample section of Baghdad City Centre by integrating GIS techniques with land use data to analyze the traffic potential and support sustainable strategies of urban planning. The approach is innovative as it fills in the missing direct traffic data gap by using spatial analysis software tools such as ArcGIS and spatial data in zoning the city, calculating land use proportions, and analyzing road network characteristics. A composite congestion index is calculated to determine and rank the most congested zones by aggregating weighted scores of traffic potential and road density analysis. The methodology is scalable and replicable and, therefore, would provide a useful framework for application in other cities where similar data limitations are experienced. It recommends targeted interventions - such as the strategic investment in parking provision, improved pedestrian and cycling infrastructure, and traffic management policies at the local scale - to address congestion and enhance sustainable urban mobility within the central business district of Baghdad.
2 Materials and methods
2.1 Study area
Baghdad’s city center has unique geographic, demographic, and infrastructural characteristics that shape its historical significance and modern challenges. Located centrally between the Tigris and Diyala rivers, elevations range from 23 to 48 meters [16]. Rapid population growth since the 20th century, driven by internal migration and urban sprawl, has significantly strained housing, services, and infrastructure [6, 17]. The city center particularly lacks green spaces, suffers from inadequate public services, and faces problems like congestion and pollution, intensified by high population density and urbanization [18-21].
A central region of Baghdad city (Fig. 1) was chosen for this study due to its demographic, historical, and infrastructural importance as Iraq’s economic, administrative, and cultural hub. This area, characterized by diverse land uses and high population density, experiences complex traffic and mobility issues and currently lacks comprehensive traffic data. The research integrates GIS techniques with land use data to analyze traffic potential, providing a scalable framework for spatial data-driven decision-making to support sustainable urban planning in Baghdad and similar urban contexts.
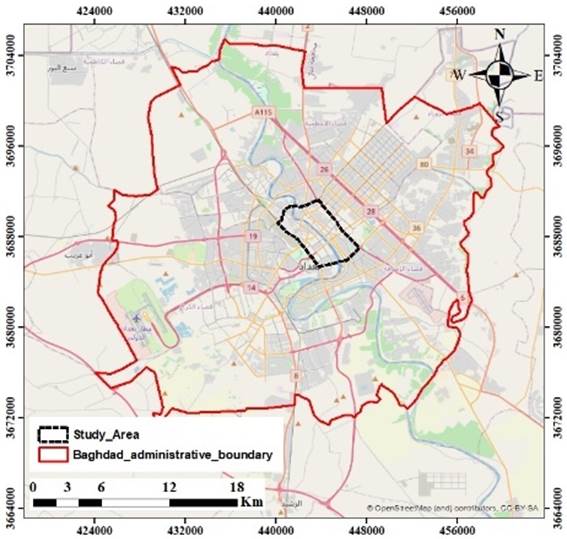
Fig. 1. Administrative boundary of Baghdad city and the selected study area
2.2 Methodological framework
To complete the requirements of this study three main phases have been adopted. Locating the most congested zones, investigating the causes of congestion, and proposing the required improvements. Accordingly, the details of adopted methods and procedures are presented as follows:
2.2.1 Data sources and tools
The shapefiles used in this research were downloaded from (https://app.mapog.com), offering detailed spatial data regarding road networks and land use. All spatial analyses were performed in ArcGIS software, which is known for its strong features in mapping, segmentation, and analytical tasks. The land use shapefile was modified with the help of Google Earth to ensure that every land use category was properly displayed within each zone. This change enabled a broader classification, describing the functional properties of all zones.
2.2.2 Zonal segmentation and area calculation
The zones were defined by the main road network, which consists of primary, secondary, and tertiary roads (Fig. 2). These boundaries were suitable for effective spatial data management and analysis. In each zone, the proportions of different types of land use were obtained by dividing the area of a specific land use type by the total area of the zone, giving a quantitative basis for assessing land use distribution. Road densities were also calculated in terms of the total length of roads within a zone divided by the area of that zone to stress infrastructure density and its capacity to handle vehicular traffic.
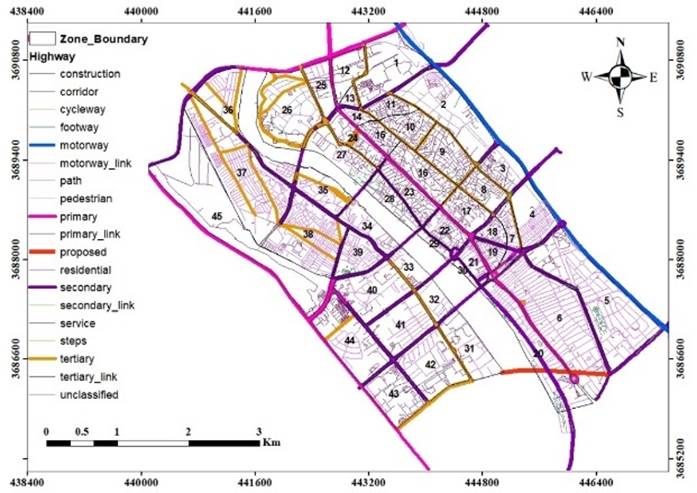
Fig. 2. Illustrates the delineation of zones based on primary, secondary, and tertiary roads, showing the road hierarchy and the classification of road types within each zone
2.2.3 Traffic potential scoring
Evaluating traffic potential is an important part of urban planning and transportation management because it makes it possible to assess how different land use types contribute to the generation of traffic and the increasing phenomenon of congestion. Weighing different land use types according to their expected impact on traffic is, therefore, an important step in developing a traffic potential model. For example, commercial areas are often assigned a higher weight because of their significant role in generating traffic, while places of worship may receive a lower weight due to their less frequent visitation patterns.
Research indicates that land use greatly impacts the generation of traffic and the degree of congestion. For instance, commercial areas, which are highly accessible and where trips are made regularly, tend to generate high volumes of traffic. This has been evidenced by the findings of various research that have established the relationship between land use intensity and the generation of traffic, with commercial areas having the most significant traffic counts in comparison to residential or recreational areas [12, 13, 22]. On the other hand, places of worship are essential but do not attract a significant number of visitors daily, justifying a lower weight in traffic potential scoring.
The Traffic Potential Score for each zone was calculated by multiplying the proportion of each land use type (relative to the zone’s total area) by assigned weights reflecting their traffic impact (Table 1). The sum of these weighted values for each zone provided an overall score, offering a quantitative measure of traffic-generating potential useful for identifying high-traffic areas and optimizing urban mobility and sustainable infrastructure planning [11, 12].
Table 1. The weights assigned to each type of area for the calculation of the traffic potential score
| Land use class | Assign weight | Land use class | Assign weight |
| Commercial | 0.5 | Historical area | 0.3 |
| Mix used | 0.5 | Hotel | 0.3 |
| Educational | 0.4 | Public Safety Facilities | 0.3 |
| Entertainment | 0.4 | Residential | 0.3 |
| Healthcare | 0.4 | Residential buildings | 0.3 |
| Industrials | 0.4 | Places of Worship | 0.2 |
| Government | 0.3 | Restricted | 0.2 |
2.2.4 Congestion Index
In this research, the Congestion Index was applied as one of the fundamental tools to assess the situation of Urban Traffic Conditions by integrating Traffic Potential Scores and Road Density into a unified metric of traffic congestion. This methodology explains how demand and infrastructure capacity jointly contribute to congestion. The Traffic Potential Score addresses the quantification of the demand for road usage, and Road Density refers to the infrastructure meeting that demand. The Congestion Index achieves an equilibrium-based assessment of traffic dynamics by assigning weights of 60% to Traffic Potential Scores and 40% to Road Density, providing a comprehensive view of traffic dynamics in the network, which has implications for urban planning and management.
To facilitate comparability and accuracy, the metrics (Traffic Potential Scores and Road Density) are standardized with the help of Min-Max normalization to bring them into the same range. This normalization process removes all possible biases from having different units or scales, thus allowing easy integration into the Congestion Index calculation. That method is important so that the metrics can be assembled without biasing from different units or scales [23, 24].
In urban traffic analysis, the Congestion Index can be used as an indicator to rank and cluster the zones based on the degree of congestion. Since larger values of the Congestion Index indicate more congestion, this provides a clear demarcation of the zones that need intervention. Areas experiencing high congestion, typically concentrated around urban centers like city centers, are generally targeted by spatial clustering analysis. It can show traffic patterns and blockages, which will be extremely useful for urban design and traffic management systems [25, 26]. Fig. 3 represents the flowchart of the methodology in traffic potential analysis, essentially depicting the steps involved in data collection, zonal segmentation, traffic potential scoring, determination of Congestion Index, and spatial clustering analysis.
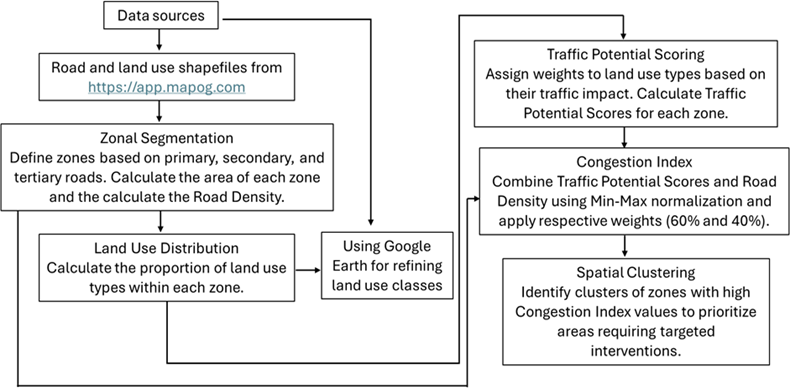
Fig. 3. The methodology flowchart for traffic potential analysis in Baghdad's city center
3 Results and discussion
3.1 Causes of congestion based on the land use, traffic pattern, and users’ responses
3.1.1 Land use patterns and their impact on traffic
The land use pattern includes residential, commercial, industrial, and public service zones, each contributing differently to traffic and congestion (Fig. 4). Residential areas dominate at 29%, significantly impacting peak commuting traffic. Mixed-use zones, combining residential and commercial functions at 10%, exhibit high traffic potential due to overlapping service demands. Commercial zones (8.51%) notably contribute to congestion, especially during working hours and weekends.
Public safety facilities (8.63%) and government sectors (3.6%) critically impact urban efficiency with localized peak-hour traffic. Industrial areas (3.52%) generate freight traffic, requiring strong infrastructure. Educational (2.87%) and healthcare (4.05%) centers provide predictable peaks to traffic. Restricted zones (11.64%) and historical regions (0.34%) have minimum traffic impact due to limited accessibility, but green spaces, 1 percent and below has a positive effect on traffic by reducing vehicle dependence in adjacent neighborhoods.
Traffic Potential Scores, calculated from land use proportions and assigned weights (Table 2), are combined with Road Density via Min-Max normalization. Assigning 60% to Traffic Potential and 40% to Road Density provides an integrated view of demand-driven traffic potential and infrastructure capacity, aiding planners in targeted interventions and sustainable urban mobility policy formulation.
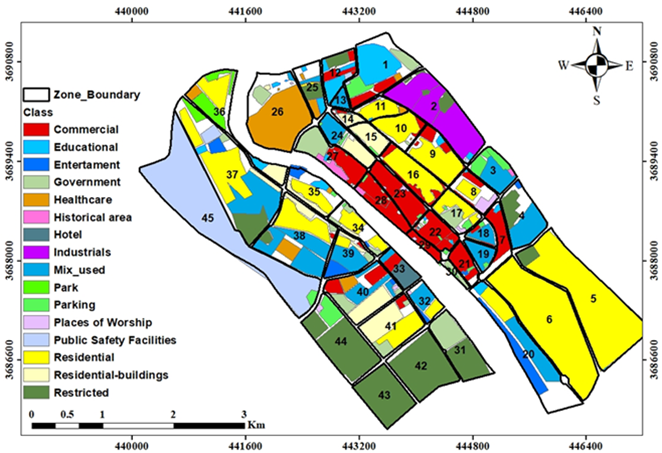
Fig. 4. Land use patterns for the study area, illustrating various land use classes
Table 2. Traffic potential score, road density, and congestion index
| Zone number | Traffic potential score | Road density km/km2 | Congestion index | Zone number | Traffic potential score | Road density km/km2 | Congestion index |
| 1 | 0.29 | 12.19 | 0.30 | 24 | 0.33 | 23.41 | 0.51 |
| 2 | 0.37 | 7.93 | 0.39 | 25 | 0.22 | 12.89 | 0.20 |
| 3 | 0.29 | 21.52 | 0.42 | 26 | 0.31 | 6.13 | 0.27 |
| 4 | 0.32 | 22.86 | 0.48 | 27 | 0.36 | 20.05 | 0.52 |
| 5 | 0.33 | 19.33 | 0.47 | 28 | 0.45 | 30.81 | 0.81 |
| 6 | 0.30 | 22.04 | 0.44 | 29 | 0.44 | 26.18 | 0.74 |
| 7 | 0.34 | 31.87 | 0.62 | 30 | 0.19 | 24.29 | 0.28 |
| 8 | 0.20 | 27.71 | 0.34 | 31 | 0.22 | 20.46 | 0.29 |
| 9 | 0.30 | 31.47 | 0.56 | 32 | 0.34 | 8.31 | 0.34 |
| 10 | 0.26 | 32.05 | 0.49 | 33 | 0.37 | 14.60 | 0.49 |
| 11 | 0.27 | 34.31 | 0.54 | 34 | 0.19 | 21.52 | 0.24 |
| 12 | 0.34 | 8.22 | 0.35 | 35 | 0.23 | 15.78 | 0.25 |
| 13 | 0.50 | 20.99 | 0.78 | 36 | 0.17 | 11.76 | 0.10 |
| 14 | 0.26 | 22.69 | 0.38 | 37 | 0.28 | 19.84 | 0.38 |
| 15 | 0.25 | 35.86 | 0.52 | 38 | 0.34 | 24.89 | 0.55 |
| 16 | 0.32 | 28.16 | 0.55 | 39 | 0.40 | 25.91 | 0.66 |
| 17 | 0.23 | 26.03 | 0.36 | 40 | 0.35 | 13.00 | 0.42 |
| 18 | 0.36 | 31.16 | 0.67 | 41 | 0.28 | 14.57 | 0.32 |
| 19 | 0.46 | 39.41 | 0.93 | 42 | 0.19 | 15.12 | 0.16 |
| 20 | 0.28 | 20.82 | 0.40 | 43 | 0.20 | 20.28 | 0.24 |
| 21 | 0.42 | 34.77 | 0.80 | 44 | 0.16 | 22.11 | 0.19 |
| 22 | 0.45 | 32.54 | 0.82 | 45 | 0.30 | 5.77 | 0.25 |
| 23 | 0.46 | 30.52 | 0.82 |
3.1.2 Road network density and accessibility
The dataset (Fig. 2) provides a variation in the level of road infrastructure across zones. A lack of cycleways and pedestrian roads suggests an overall deficiency of non-motorized transport infrastructure. The high-density areas have residential and service roads as major local access roads that enhance local connectivity. On footways, such are seen to be present in specific zones (e.g., Zone 26) but largely disappear elsewhere, indicating irregularity in pedestrian infrastructure.
Road density analysis (km/km²) in Table 2 shows great variation across the zones. It is high in very high-density zones above 30 km/km², like Zones 10, 15, and 22, where the residential networks, service roads, and some cycling and footway infrastructure have effectively met traffic demands. Conversely, it is low in very low-density zones below 10 km/km², like Zones 2, 12, and 45, where poor network shows limited accessibility.
Combining road density with Traffic Potential Scores gives a good indication of urban congestion conditions. Very high road densities, by themselves, do not immediately indicate low congestion since the congestion level depends more on the interaction of road net infrastructures with the level of demand. In high-density areas with strong traffic potential, congestion may be severe even with well-built road systems. In contrast, in low-density areas of low demand, congestion may well remain light, even with inadequate road infrastructure.
3.1.3 Spatial clustering of zones with high congestion index
This research calculates the Congestion Index by combining normalized Traffic Potential Scores (60% weight) and Road Density (40% weight) to analyze urban traffic congestion. Zones with high Congestion Index values (e.g., Zones 19, 23, and 22) experience heavy congestion due to high traffic demand despite moderate road density (Fig. 5). Conversely, lower Congestion Index zones show a better balance between traffic demand and infrastructure capacity.
To further clarify the severity of congestion, the Congestion Index values were ranked into six categories. The zones with Congestion Index values between 0.65 and 0.9 were ranked as 1, indicating the highest levels of congestion. Those zones with values from 0.65 to 0.5 were ranked 2, while values between 0.4 and 0.5 were ranked 3. The zones with Congestion Index values of 0.3 to 0.4 were ranked as 4, from 0.2 to 0.3 as 5, and from 0.09 to 0.2 as 6, which represent the least congested areas (Fig. 5).
This study introduces a new scalable, spatial data-driven framework combining Traffic Potential Scores and road density to assess urban congestion. Clustering and ranking the Congestion Index provide clear insights to prioritize intervention areas, supporting effective traffic management, improved mobility, and balanced infrastructure development, especially in cities like Baghdad.
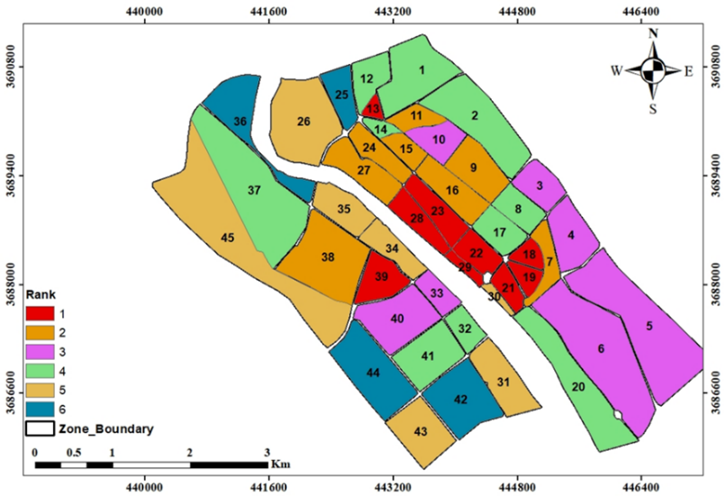
Fig. 5. Spatial distribution and clustering of zones based on Congestion Index rankings
3.1.4 Traffic patterns and congestion
Traffic patterns and congestion in Baghdad’s city center are significantly influenced by traffic potential, land use patterns, and road density. The Congestion Index (CI), combining Traffic Potential Scores (60%) and road density (40%), enables detailed analysis of congestion within a GIS framework, facilitating targeted recommendations for improving urban mobility.
Residential areas (29% of land) significantly contribute to peak-hour congestion due to high population density and commuting patterns (Fig. 4). Mixed-use areas (10%) exhibit persistent congestion from overlapping residential and commercial activities, increasing travel demand. These findings validate the use of land-use data to model traffic potential, aligning with research linking congestion to mixed land-use patterns and emphasizing integrated urban planning for improved mobility [27, 28].
Commercial areas occupy 8.51% of the land but contribute significantly to traffic congestion during peak hours and weekends due to consumer activity, deliveries, and employee commutes. It has been empirically proven that there is a very strong relationship between commercial densities and the flow of traffic in central urban areas [29], which calls for a more focused traffic-management approach in such areas.
Industrial land, though only 3.52% of the area, heavily impacts traffic due to freight and heavy vehicle movement, causing bottlenecks and congestion. Studies highlight the need for freight-only roads and time restrictions to reduce environmental and mobility challenges [30]. These are some of the issues that must be addressed to balance industrial activities and general urban mobility.
High road density (>30 km/km²) (Table 2) can ease congestion, as seen in Zones 19, 21, and 22. However, areas like Zone 21 (Fig. 2) still face severe peak-time congestion due to high traffic demand. This aligns with studies indicating that although high road density can mitigate congestion, it fails to resolve the issue at extraordinarily high levels of traffic demand [31, 32].
Low-density zones (<10 km/km²), like Zones 2, 12, and 45, often face congestion due to limited infrastructure, even under moderate traffic. Research shows such areas lack the capacity to handle higher traffic volumes, leading to delays and bottlenecks [33, 34]. This supports the need for targeted infrastructure investment. Integrating land use, traffic potential, and road density provides essential insights for planners to address congestion in Baghdad.
3.1.5 Congestion severity and spatial trends
The ranking of congestion severity in Baghdad’s city center (Fig. 5), derived from the Congestion Index (CI), reflects the combined influence of Traffic Potential Scores (60%) and road density (40%), offering a comprehensive perspective on congestion patterns and severity.
High congestion zones and main roads
Major roads serve as key corridors connecting residential, commercial, and industrial areas, but they often face congestion due to high traffic and limited capacity. Table 3 outlines the lengths of the main roads, while Fig. 6 provides a spatial representation of these roads and their significance in the city center.
Table 3. Lengths of Main Roads in the study area
| Road name | Length (m) | Road name | Length (m) |
| Sheikh Omar Street | 3088 | 24th street | 284 |
| King Ghazi Street | 3622 | Bab al-Muatham Bridge | 814 |
| Al Khulafa Street | 3158 | Al-Nusair Street | 816 |
| Rasheed Street | 3157 | Museum Street | 757 |
| Haifa Street | 3960 | Safi Al-Din Al-Hilli Street | 1920 |
| Al-Khalani Street | 749 | Sarrafiya Bridge | 426 |
| Republic Bridge | 970 | Al-Mutasim Street | 1470 |
| Sinak Bridge | 761 | Al-Mutawakkil Street | 460 |
| Al-Ahrar Bridge | 659 | Abu Tammam Street | 533 |
| Martyrs Bridge | 341 | 35 Street | 634 |

Fig. 6. Map showing the layout of main roads, bridges and public terminals parking in the study area
The Congestion Index (CI) map (Fig. 5) highlights key areas needing intervention. Zones ranked 1 and 2, such as those near Sheikh Omar, King Ghazi, Rasheed, and Haifa Streets, show severe congestion due to inadequate infrastructure (Fig. 6). These findings underscore the value of combining spatial GIS-based and land use data to detect mismatches between infrastructure and traffic demand.
The Congestion Index (CI) highlights critical zones needing intervention, especially around Sheikh Omar, King Ghazi, Rasheed, and Haifa Streets (Fig. 5 and Fig. 6). Sheikh Omar Street (3,088 m) faces heavy freight traffic and curb parking issues due to nearby industrial areas. Haifa Street (3,960 m) endures persistent congestion from mixed land use and bridge through traffic. Al Khulafa Street (3,158 m) has high traffic potential due to surrounding residential and commercial zones. These findings underscore the value of GIS integrated with land use data in mismatching infrastructure with demand to facilitate targeted interventions to alleviate congestion.
Curb parking and road capacity
The study area includes large garages like Bab Al-Muatham (46,361 m²) and Al-Wasiti (36,504 m²), but many smaller ones, such as Sinak and Al-Rusafi (under 4,000 m²), offer limited capacity (Table 4, Fig. 6). This leads to heavy reliance on curb parking along major roads. Studies show curb parking reduces road capacity by 12–22% [35]. especially on key streets like Al-Rasheed and Al Khulafa, which connect to major commercial areas. High congestion in these zones highlights the impact of unregulated curb parking (Fig. 7-A).
Impact of bridges on through-traffic
Some of the most important bridges in central Baghdad, Bab al-Muatham, Sinak, and Republic Bridges over the Tigris River (Fig. 6), can serve as chokepoints for the limited capacities and close spacing for these bridges, not only for the roads directly leading into the bridges but also the congestion that results in adjacent arterial roads.
Traffic around these bridges, especially at Al-Tahrir roundabout near Republic Bridge (Fig. 7-B), is persistently among the most congested due to high traffic volumes crossing the river.
Activities and limited transit systems
Traffic congestion in central Baghdad is exacerbated by heavy pedestrian traffic and an inefficient public transportation system. Streets like Al-Khalani and Al-Rasheed (Fig. 6) face pedestrian cross-spill due to shop encroachments and parking blocking footpaths, leading to competition for road space (Fig. 7-C). In addition, the city relies on unstructured paratransit and three-wheel carriages, with overlapping pick-up/drop-off points further disrupting traffic (Fig. 7-D). A requisite GIS analysis to reveal this information would be helpful in establishing and optimizing other routes in urban mobility improvements.
Table 4. Areas of the garages that presented in Figure 6
| Garage name | Area (m2) | Garage name | Area (m2) |
| Al-Wasiti | 36,500 | Sinak | 3,760 |
| Al-Nahtha | 4,465 | Bab Al-Muatham | 46,360 |
| Al-Rusafi | 3,855 | Maidan | 4,535 |
| Bab Al-Sharqi | 8,035 | Allawi | 1,9625 |
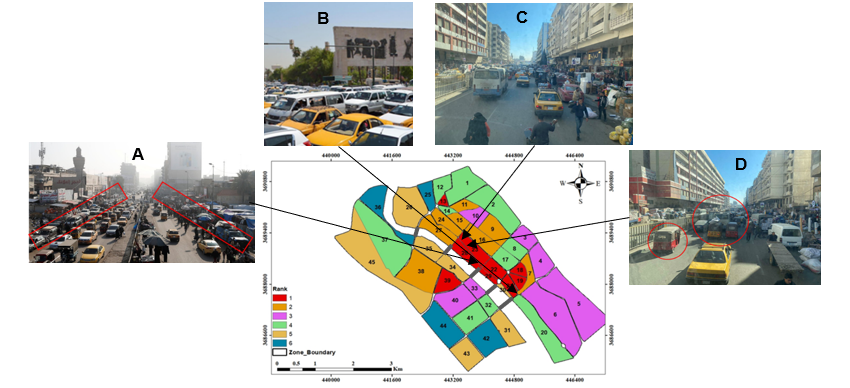
Fig. 7. Different kinds of traffic congestion cause in Baghdad city center
Unproductive land use
Unproductive land use, like the case of poorly utilized industrial zones, adds to the problems of inefficiency in urban mobility within Baghdad. Though the land accounts for just 3.52% of the area (see Fig. 2), it generates substantial traffic due to regular movements involving freight. Areas have been identified through GIS analysis where, in most cases, they contribute to creating bottlenecks, especially on arterial roads linking industrial zones with the wider city.
3.1.6 Users’ responses
To assess traffic conditions in Baghdad's city center, a questionnaire was distributed to about 750 pedestrians and drivers of varied ages and educational backgrounds. After excluding 140 incomplete responses, the remaining were analyzed. A minimum sample size of 385 was determined using Hernon [36] unlimited population formula (95% confidence level, z=1.96, population proportion 50%, margin of error 5%).
| $n=\frac{z^2x\ \hat{p}\ (1-\hat{p})}{e^2} $ | (1) |
Where: z: score against area under normal curve, e: error margin, ![]() population proportion, and
population proportion, and ![]() sample size.
sample size.
Figures 8-11 summarize survey results of Baghdad city center users, showing user characteristics, traffic patterns, transport preferences, visit purposes, and congestion causes, mostly supporting findings from the GIS analysis. Traffic was primarily passing or stationary, due to limited bridges, inadequate parking, and disorganized public transit. Shopping, work, and study were main visit purposes; users preferred nonmotorized transport if infrastructure improves.
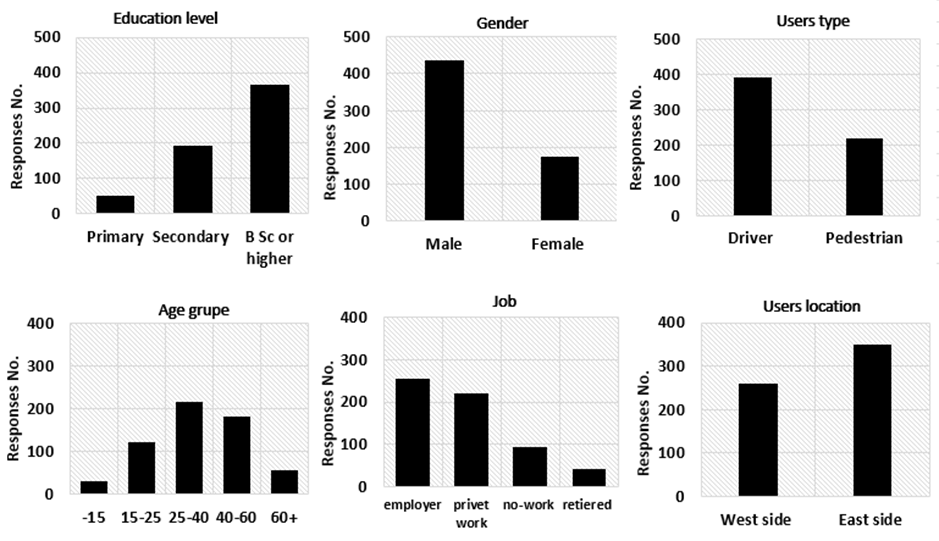
Fig. 8. The users’ information, who contributed in opinions surveys at Baghdad city center
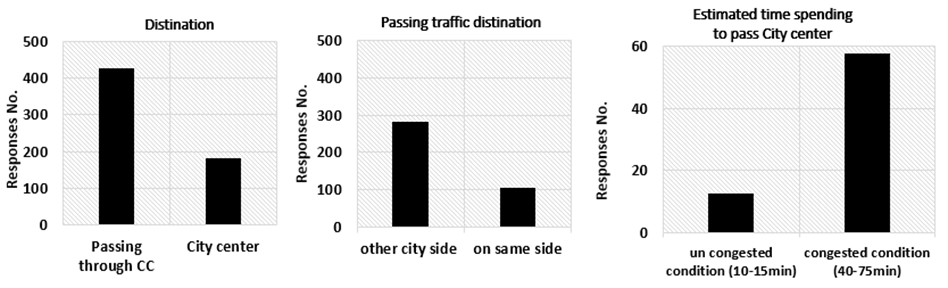
Fig. 9. Traffic pattern at Baghdad city center
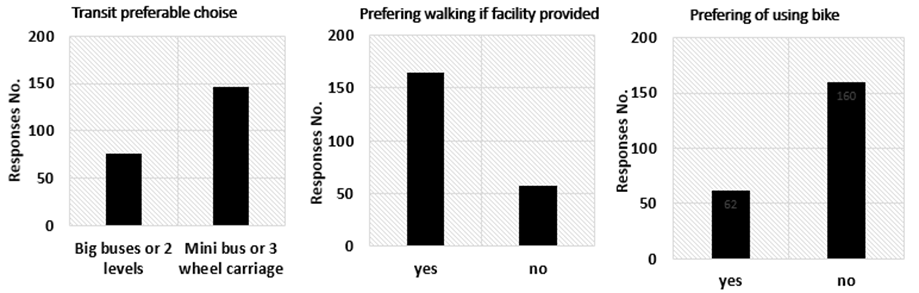
Fig. 10. Users’ preferability for public transit and non-motorized transport modes
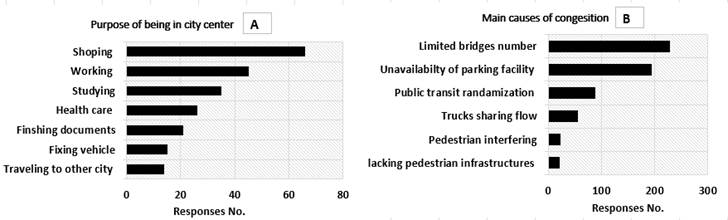
Fig. 11. (A)Purposes of being at Baghdad city center. (B) The main congestion causes at Baghdad city center according to users’ responses
3.2 Proposed required improvements – short, intermediate, and long term.
The findings have high congestion negatively impacting the main arterial roads into the central business district of Baghdad, which includes streets like Sheikh Omar, King Ghazi, Al-Rasheed, and Haifa— all very important commercial, residential, and industrial corridors. This area should be considered a priority for improvements to ease traffic flow further and reduce traffic delay. Infrastructure improvements, traffic management, and sustainable mobility improvements shall be recommended in the short, medium, and long terms (Tables 5-7).
Such measures are spatial and data-driven and also resonate with the goals of the City Sustainability Plan. The proposed steps are:
- Short-Term (0–1 year): Immediate, low-cost interventions with high impact, requiring minimal infrastructure changes.
- Medium-Term (1–3 years): Actions needing moderate investment and policy adjustments.
- Long-Term (+3 years): Major infrastructure projects and policy reforms.
The requirements and actions for each required improvement are illustrated in the following tables based on the proposed time-term for each group of developments.
Table 5. Short-term (0-1year) proposed improvements
| Improvements | Requirements | Action |
| Parking infrastructure optimization | - Implement multi-level parking structures | - Construct multi-level parking at Al-Wasiti Garage (36,504 m²) and Bab Al-Muatham Garage (46,361 m²) to serve about 10,000–13,000 vehicles. |
| - Eliminate curb parking along primary routes (e.g., Sheikh Omar Street, King Ghazi Street, Al-Rasheed Street) to increase road capacity by up to 30%. | ||
| - Enforce curb parking regulations | - Implement strict curb parking restrictions in high-traffic zones. | |
| - Introduce smart parking management systems with designated drop-off areas to limit cars parked illegally on the roadside. | ||
| Freight traffic restrictions | - Time-based restrictions for heavy vehicles | - Restricts freight movement in city center zones at peak hours. |
| - Reroute freight traffic onto newly designated routes outside of the urban core. | ||
| - Set up dedicated freight routes | - Designate freight corridors along Sheikh Omar Street and King Ghazi Street to reduce traffic in mixed-use area. | |
| Reduce the traffic interruptions | - Enhance current intersections | - Upgrade traffic signal timing and improve lane efficiency at identified bottlenecks (Haifa Street, King Ghazi Street, Rasheed and Al-Khulafa Streets). |
| - Improve the geometry of intersections to improve traffic flow. | ||
| - Improve the pavement condition | - Doing the required routine and major maintenance to maintain the traffic service in acceptable level. | |
| Non-motorized transport infrastructure | - Enhance pedestrian facilities | - Improve footpaths and crossings in areas of high commercial traffic (Al-Rasheed Street, Al-Khalani Street). |
| - Improve zebra crossings and pedestrian bridges to reduce conflicts between pedestrians and vehicles. | ||
| - Create dedicated cycling & walking lanes | - Develop separated bicycle lanes along Al-Khulafa Street (3.2 km), Al Rasheed Street (3 Km) and Haifa Street (4 km). |
Table 6. Mid-term (1-3years) proposed improvements
| Improvements | Requirements | Action |
| Public transit development | - Introduce a structured Public Transit System (PTS) within the city and its surroundings. The proposed system involves a structured bus-based public transport subsystem where standard buses and electric buses are to run to reduce vehicular emissions. Further improvement shall also include the introduction of dedicated bus lanes and exclusive transit corridors for buses and taxis to ensure travel time reliability as well as to give mass transit priority over private vehicles. | - Implement dedicated bus lanes on major roads. - Develop integrated transit hubs near multi-level parking facilities for last-mile connectivity. - Prioritize Zones with high congestion and transit demand. |
| - Regulate Paratransit and Three-Wheel Carriages. - Establish stop and route structures to eliminate random pick-up/drop-off of passengers which are disrupting the flow of traffic. | ||
| Smart traffic management systems | - Deploy AI-based traffic monitoring | - Use cameras and sensors for real-time data collection on traffic and dynamic adjustments of traffic signals. |
| - Use GIS-based analytics in monitoring and predicting congestion patterns. | ||
| Public awareness & Traffic law enforcement | - Launch public awareness campaigns | - Promote public transport and non-motorized mobility. |
| - Inform drivers about curb parking regulations and measures to reduce congestion. | ||
| - Strengthen law enforcement | - Freight movement, curb parking, and pedestrian safety laws to be enforced with no exceptions. | |
| - Traffic police to be deployed in areas of high congestion for enforcement. |
Table 7. Long-term (+3years) proposed improvements
| Improvements | Requirements | Action |
| Improve the road network of Baghdad city | - Construct additional bridges & ring roads | - Construct new bridges to take away the passing traffic from the city center to reduce congestion - Develop strategic interchanges that can connect the ring road to arterial streets. |
| Land use and urban planning adjustments | - Rezone industrial areas | - Transform underutilized industrial areas into green spaces or mixed-use developments to improve land efficiency. - Reduce commercial sprawl by encouraging vertical development in commercial zones. |
4 Conclusions
This study used land use data and GIS techniques to assess traffic and congestion in Baghdad’s city center, creating a spatial, data-driven framework for urban mobility planning. By combining road density and traffic potential, key congested corridors—Sheikh Omar, King Ghazi, Al-Rasheed, and Haifa Streets—were identified. Based on users’ responses, two traffic types were observed: passing (through traffic) and stationary (visitors to the city center). The concentration of bridges in the center (5 out of 12 citywide) increases pressure on connecting roads, while limited parking results in widespread curb parking, reducing road capacity. Other factors contributing to congestion include mixed land use, lack of regulations, pedestrian interference, and the absence of a structured public transit system.
To address these issues, the study proposes a phased approach. In the short term (0–1 year), actions should focus on regulating curb parking, expanding organized parking facilities, improving pedestrian and cycling infrastructure, and managing freight movement. In the medium term (1–3 years), the introduction of a structured public transit system and the implementation of smart traffic management technologies are recommended. For the long term (beyond 3 years), priorities include upgrading the road network, making adjustments to land use and urban planning, and enhancing public awareness along with stricter traffic law enforcement.
Acknowledgements
The authors thank the College of Engineering at Mustansiriyah University (www.uomustansiriyah.edu.iq) for their help in completing this study.
References
- Miller, H. J. (2020). Movement analytics for sustainable mobility. *Journal of Spatial Information Science*, *20*, 115–123. https://doi.org/10.5311/josis.2020.20.663
- Stan, M.-I., Tasențe, T., & Rus, M. (2023). Challenges and opportunities regarding the COVID-19 pandemic on urban mobility in Constanta, Romania. *Technium Social Sciences Journal*, *42*(1), 1–14. https://doi.org/10.47577/tssj.v42i1.8755
- Albatayneh, O., Gaweesh, S. M., & Husein Malkawi, D. A. (2024). Forward-thinking for sustainable shared mobility solutions in Amman. *Sustainability*, *16*(2), 732. https://doi.org/10.3390/su16020732
- Mohowes, Z. T., & Al-Jiboori, M. H. (2023). Assessing urbanization in the surroundings of International Baghdad Airport using Landsat data. *IOP Conference Series: Earth and Environmental Science*, *1223*(1), 012021. https://doi.org/10.1088/1755-1315/1223/1/012021
- Moussa, Y. K. H., & Alwehab, A. A. (2022). The urban expansion impact on climate change for the city of Baghdad. *Iraqi Journal of Science*, *63*(11), 5072–5085. https://doi.org/10.24996/ijs.2022.63.11.41
- Fazaa, N. A., et al. (2022). Land use change in Baghdad city and assessment of the Jadriyah and Umm Al-Khanazeer Island Important Bird Area (IBA) from 1984 to 2020. *Baghdad Science Journal*, *19*(6 Suppl.), 1471. https://doi.org/10.21123/bsj.2022.7033
- Omer, K. (2022). Transforming slums through urban intensification. *World Journal of Science Technology and Sustainable Development*, *19*(1), 55–66. https://doi.org/10.47556/j.wjstsd.19.1.2022.5
- Naif, S. S., Al-Jiboor, M., & Hadi, N. M. (2020). Study of temporal variations of nocturnal and daytime urban heat island in Baghdad. *Przegląd Naukowy Inżynieria i Kształtowanie Środowiska*, *29*(3), 355–365. https://doi.org/10.22630/pniks.2020.29.3.30
- Alshammari, L. A., Ridha, S., & Al-shammari, M. (2025). Monitoring the urban heat island effect in Baghdad using Sentinel-3 and OSM data integration for sustainable urban planning. *Journal of Applied Engineering Science*, *23*(1), 151–164. https://doi.org/10.5937/jaes0-54589
- Lopa, A. T., Hasrul, M. R., & Yanti, J. (2022). Land use changes on traffic generation: A study in the Tallasa City corridor. *International Journal of Environment, Engineering and Education*, *4*(1), 27–35. https://doi.org/10.55151/ijeedu.v4i1.70
- Tal, R. A., Theodory, R., & Bazlamit, S. M. (2023). Assessing the intersected relationship between land use and transportation planning. *Geography, Environment, Sustainability*, *15*(4), 80–89. https://doi.org/10.24057/2071-9388-2022-008
- Asmael, N. M., Al-Taweel, H. M., & Waheed, M. (2024). Exploring an interaction model for land use intensity-traffic congestion. *Periodica Polytechnica Transportation Engineering*, *52*(3), 270–275. https://doi.org/10.3311/PPtr.23305
- Yap, J. Y., Omar, N., & Ismail, I. (2022). A study of traffic congestion influenced by the pattern of land use. *IOP Conference Series: Earth and Environmental Science*, *1022*(1), 012035. https://doi.org/10.1088/1755-1315/1022/1/012035
- Zhang, M., et al. (2021). Vulnerability and resilience of urban traffic to precipitation in China. *International Journal of Environmental Research and Public Health*, *18*(23), 12342. https://doi.org/10.3390/ijerph182312342
- Chen, Y., et al. (2022). Resilience assessment of multimodal urban transport networks. *Journal of Circuits, Systems and Computers*, *31*(18), 22503108. https://doi.org/10.1142/s0218126622503108
- Hammood, H. K., Al Ramahi, F. K. M., & Hussain, H. S. (2022). Measurement and analysis of the distribution of Pb-214 lead isotope in Baghdad soil using remote sensing techniques. *Iraqi Journal of Science*, *63*(2), 897–907. https://doi.org/10.24996/ijs.2022.63.2.41
- Al-Hameedi, W. M. M., et al. (2021). Remote sensing-based urban sprawl modeling using multilayer perceptron neural network Markov chain in Baghdad, Iraq. *Remote Sensing*, *13*(20), 4034. https://doi.org/10.3390/rs13204034
- Alwan, N. F., & Al-Nuaimi, M. (2018). The role and importance of Internet of Things in building sustainable city. *Engineering and Technology Journal*, *36*(1C), 22–29. https://doi.org/10.30684/etj.36.1c.5
- Majeed, F. A., & Abaas, Z. R. (2023). An analysis of Baghdad’s masterplans based on the development of green areas. *Acta Scientiarum Polonorum. Administratio Locorum*, *22*(2), 193–208. https://doi.org/10.31648/aspal.8234
- Mohammed, Z. B., et al. (2019). Assessment of air pollution over Baghdad city using fixed annual stations and GIS techniques. *Journal of Southwest Jiaotong University*, *54*(6), 1–12. https://doi.org/10.35741/issn.0258-2724.54.6.36
- Salih, S. A., Ismail, S., & Sabil, A. (2021). The sustainable city: The characteristic public urban green space for enhancing community social sustainability in Baghdad. *International Journal of Sustainable Construction Engineering and Technology*, *12*(3), 202–214. https://doi.org/10.30880/ijscet.2021.12.03.020
- Kanyepe, J., Tukuta, M., & Chirisa, I. (2021). Urban land-use and traffic congestion: Mapping the interaction. *Journal of Contemporary Urban Affairs*, *5*(1), 77–84. https://doi.org/10.25034/ijcua.2021.v5n1-6
- Afrin, T., & Yodo, N. (2020). A survey of road traffic congestion measures towards a sustainable and resilient transportation system. *Sustainability*, *12*(11), 4660. https://doi.org/10.3390/su12114660
- Wang, W., Ren, G., & Yu, J. (2018). Research on road traffic congestion index based on comprehensive parameters: Taking Dalian city as an example. *Advances in Mechanical Engineering*, *10*(6), 1–8. https://doi.org/10.1177/1687814018781482
- Bari, C., Gunjal, T. V., & Dhamaniya, A. (2022). A simulation approach for evaluating congestion and its mitigation measures on urban arterials operating with mixed traffic conditions. *Communications - Scientific Letters of the University of Zilina*, *24*(3), D126–D140. https://doi.org/10.26552/com.c.2022.3.d126-d140
- Samal, S. R., Mohanty, M., & Santhakumar, S. M. (2022). Assessment of traffic congestion under Indian environment - A case study. *Communications - Scientific Letters of the University of Zilina*, *24*(4), D174–D182. https://doi.org/10.26552/com.c.2022.4.d174-d182
- Droj, G., Laurenţiu, D., & Badea, A. (2021). GIS-based survey over the public transport strategy: An instrument for economic and sustainable urban traffic planning. *ISPRS International Journal of Geo-Information*, *11*(1), 16. https://doi.org/10.3390/ijgi11010016
- Peera, K. M., Shekhawat, R. S., & Prasad, C. S. R. K. (2019). Traffic analysis zone level road traffic accident prediction models based on land use characteristics. *International Journal for Traffic and Transport Engineering*, *9*(4), 376–386. https://doi.org/10.7708/ijtte.2019.9(4).03
- Horstmann, S., et al. (2024). Traffic intensity and vegetation management affect flower‐visiting insects and their response to resources in road verges. *Journal of Applied Ecology*, *61*(8), 1955–1967. https://doi.org/10.1111/1365-2664.14692
- Priambodo, B., Ahmad, A., & Kadir, R. A. (2020). Prediction of average speed based on relationships between neighbouring roads using K-NN and neural network. *International Journal of Online and Biomedical Engineering*, *16*(1), 18–33. https://doi.org/10.3991/ijoe.v16i01.11671
- Saleh, R. M., et al. (2018). Comparative evaluation for speed-density models for highways in developing countries: A case study in Egypt. *Journal of Applied Sciences Research*, *14*(2), 1–8. https://doi.org/10.22587/jasr.2018.14.2.1
- Yu, Y. J., et al. (2020). Macroscopic fundamental diagram based road network characteristics identification and simulation. *E3S Web of Conferences*, *165*, 04051. https://doi.org/10.1051/e3sconf/202016504051
- Supriatna, S., Dimyati, M., & Amrillah, D. (2020). Spatial model of traffic congestion by the changes on city transportation route. *International Journal on Advanced Science Engineering and Information Technology*, *10*(5), 2044–2047. https://doi.org/10.18517/ijaseit.10.5.6752
- Suwanno, P., et al. (2021). Application of macroscopic fundamental diagram under flooding situation to traffic management measures. *Sustainability*, *13*(20), 11227. https://doi.org/10.3390/su132011227
- Zhao, Q., et al. (2024). The influence of parallel curb parking on traffic capacity at an intersection. *Heliyon*, *10*(1), e23935. https://doi.org/10.1016/j.heliyon.2023.e23935
- Hernon, P. (1994). Determination of sample size and selection of the sample: Concepts, general sources, and software (Research note). *College & Research Libraries*, *55*(2), 171–179. https://doi.org/10.5860/crl_55_02_171
Conflict of Interest Statement
The authors declare that there is no conflict of interest regarding the publication of this paper.
Author Contributions
Data Availability Statement
All data is publicly available from cited web sources.
Supplementary Materials
No supplementary materials are available.